Scan Nodes
By default, Cloudhouse Guardian (Guardian) automatically scans all of the nodes within the Monitored tab (
Tip: During certain integration syncs or bulk add process, you can select the Automatically start monitoring and scanning newly detected nodes option to detect and scan nodes every 2 hours. For more information, see Nodes.
The following processes assume that you have a Connection Manager or Agent correctly configured for each of the nodes you want to scan. For more information on each of the available scanning methods, see Guardian Agent
Manual Scans
Even though Guardian automatically scans nodes every day by default, there are different ways you can trigger a manual scan without having to wait for the next automatic scan to be triggered:
-
You can select one or more nodes for scanning from the Monitored tab. For more information, see Node(s) Scan.
-
You can select individual node groups for scanning from the Monitored tab. For more information, see Node Group Scan.
-
You can select a node for scanning from the node scan results page within the Monitored tab. For more information, see Node Scan Results Page.
Note: Alternatively, you can schedule a recurring node scan or configure a node scan that automatically occurs when certain events take place. For more information, see Job Schedule and Event Actions.
Node(s) Scan
To trigger a manual scan of one or more nodes, complete the following steps:
-
In the Guardian web application, navigate to the Monitored tab. By default, all currently monitored nodes are displayed in the 'All Nodes' node group.
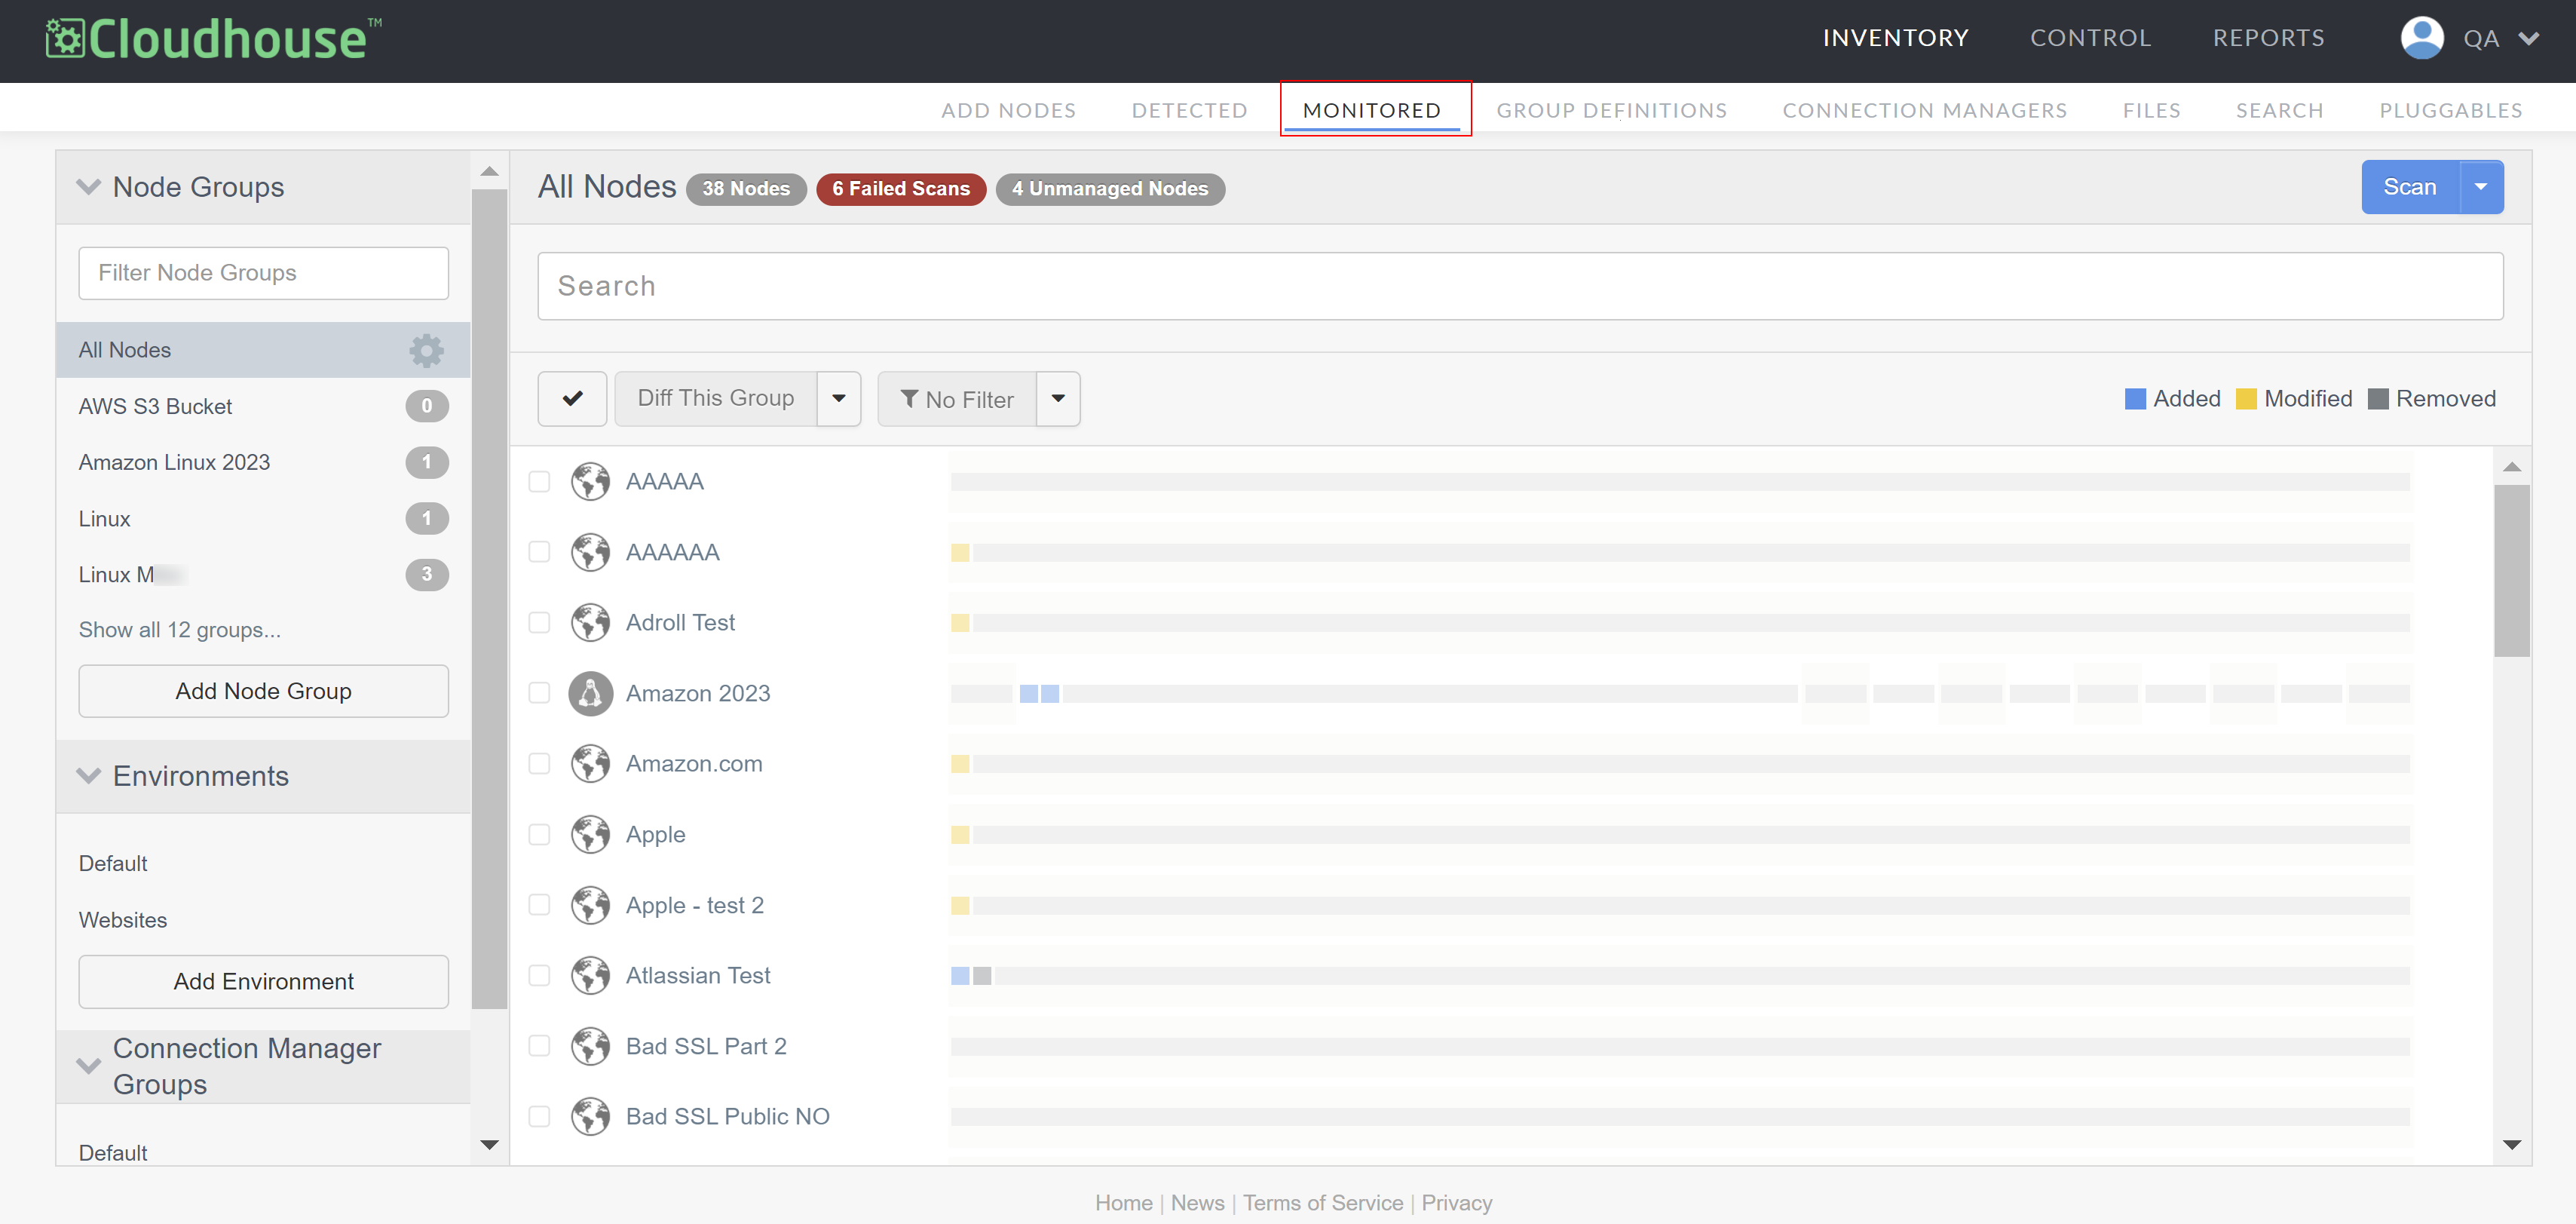
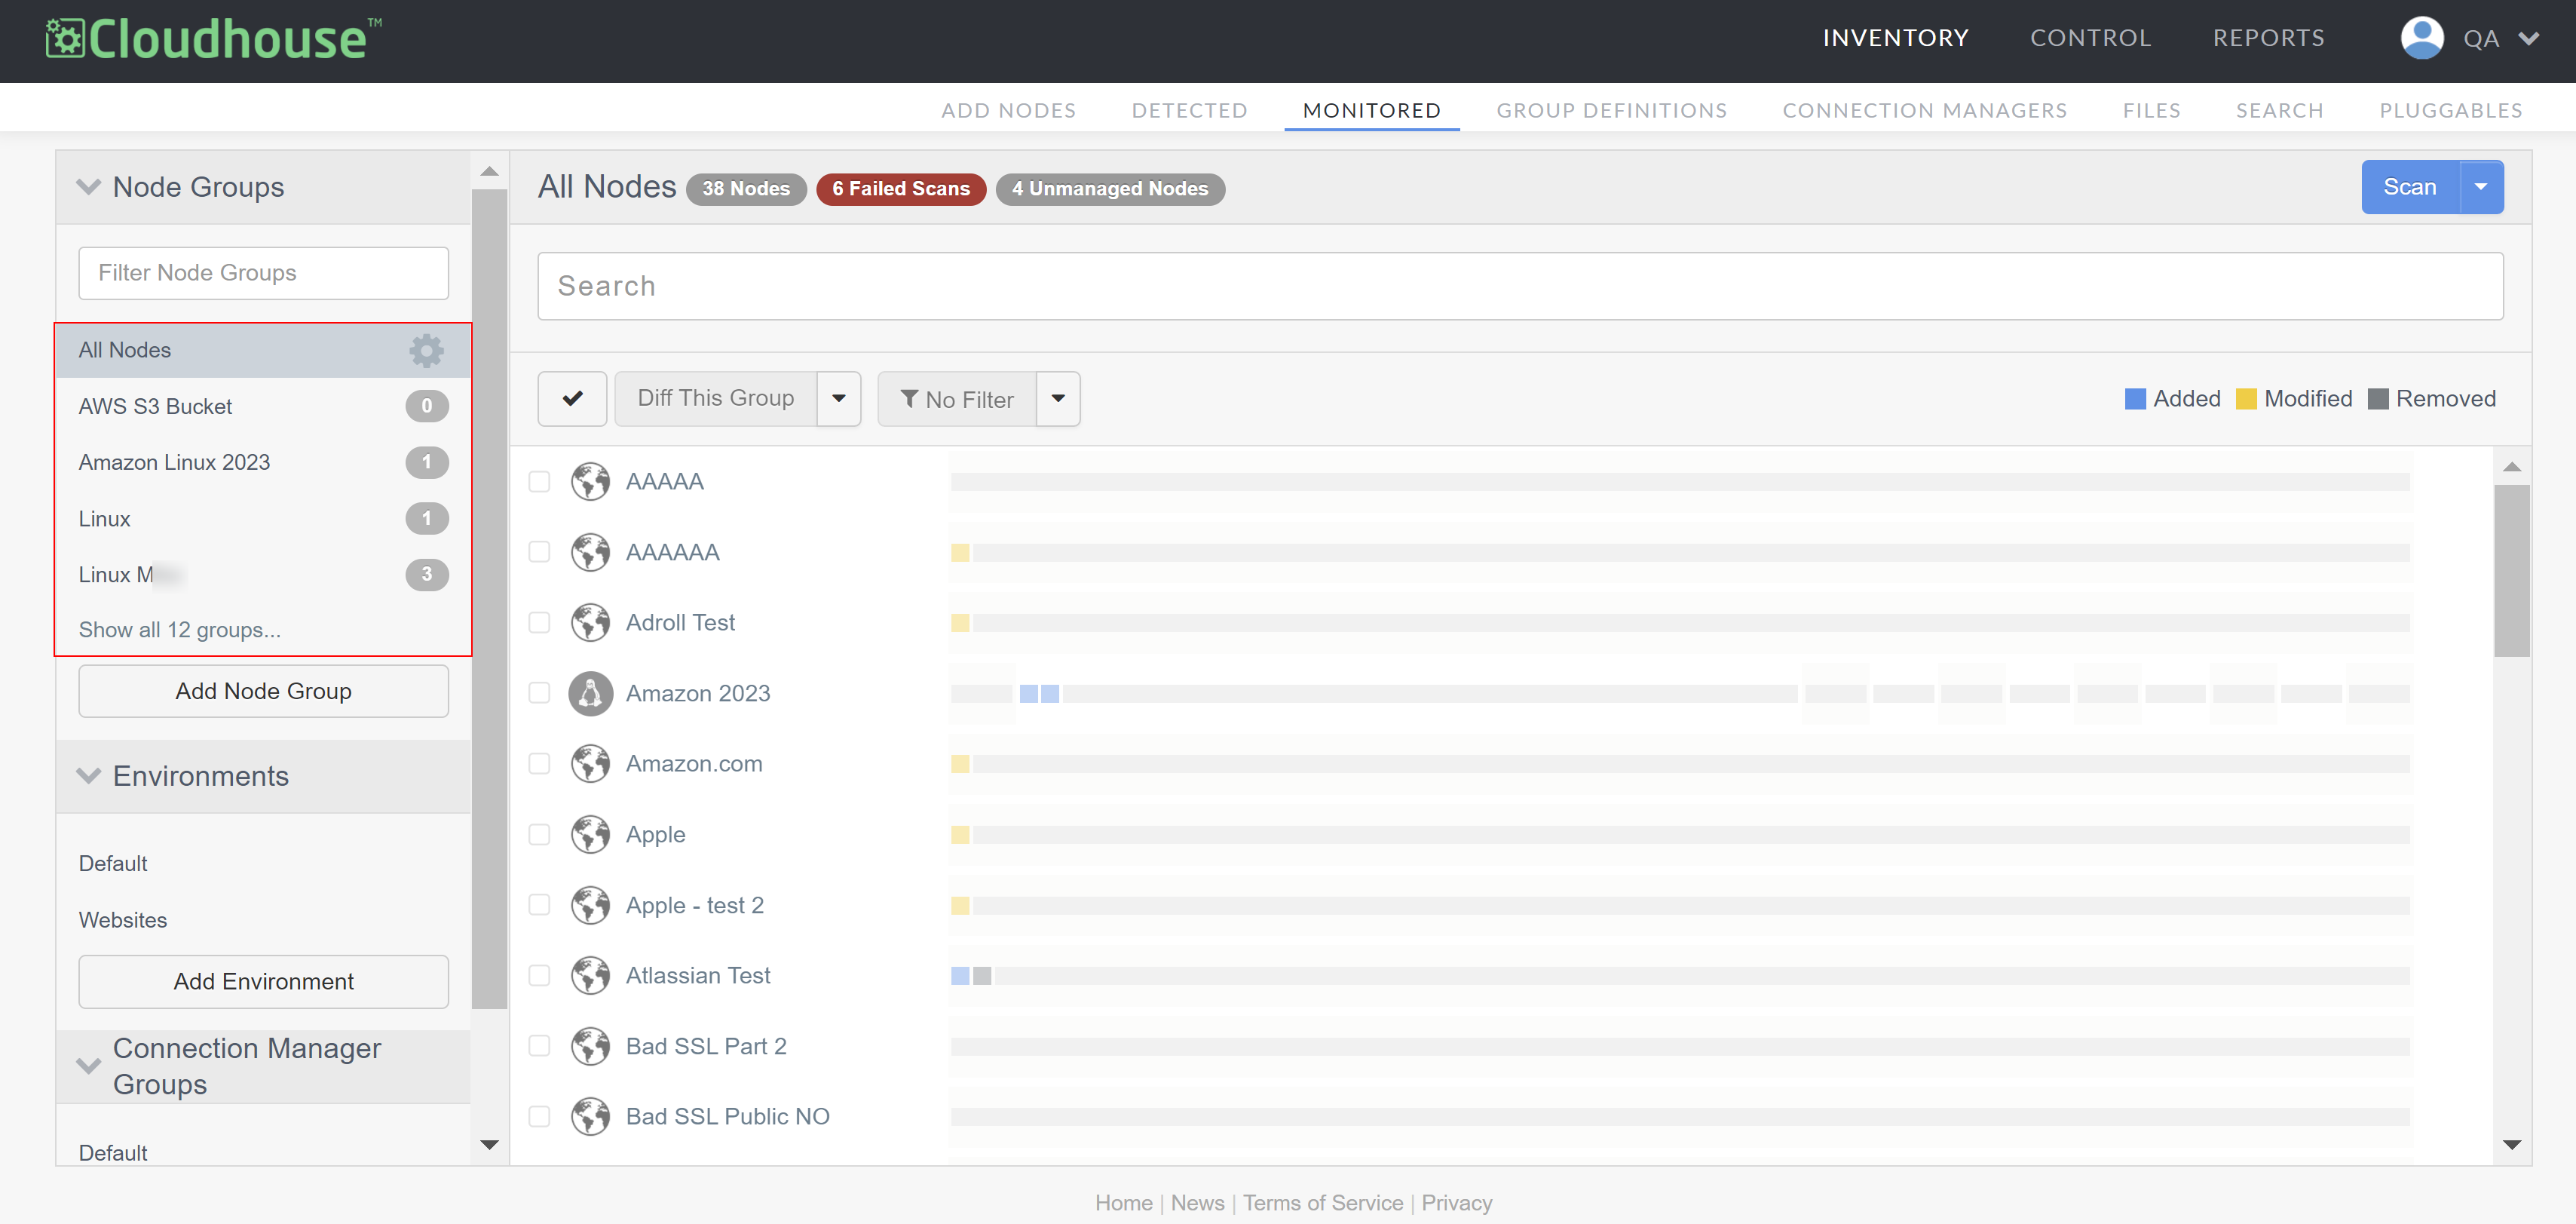
Note: If you want to display the list of monitored nodes of a different node group, select a node group from the Node Groups drop-down menu.
-
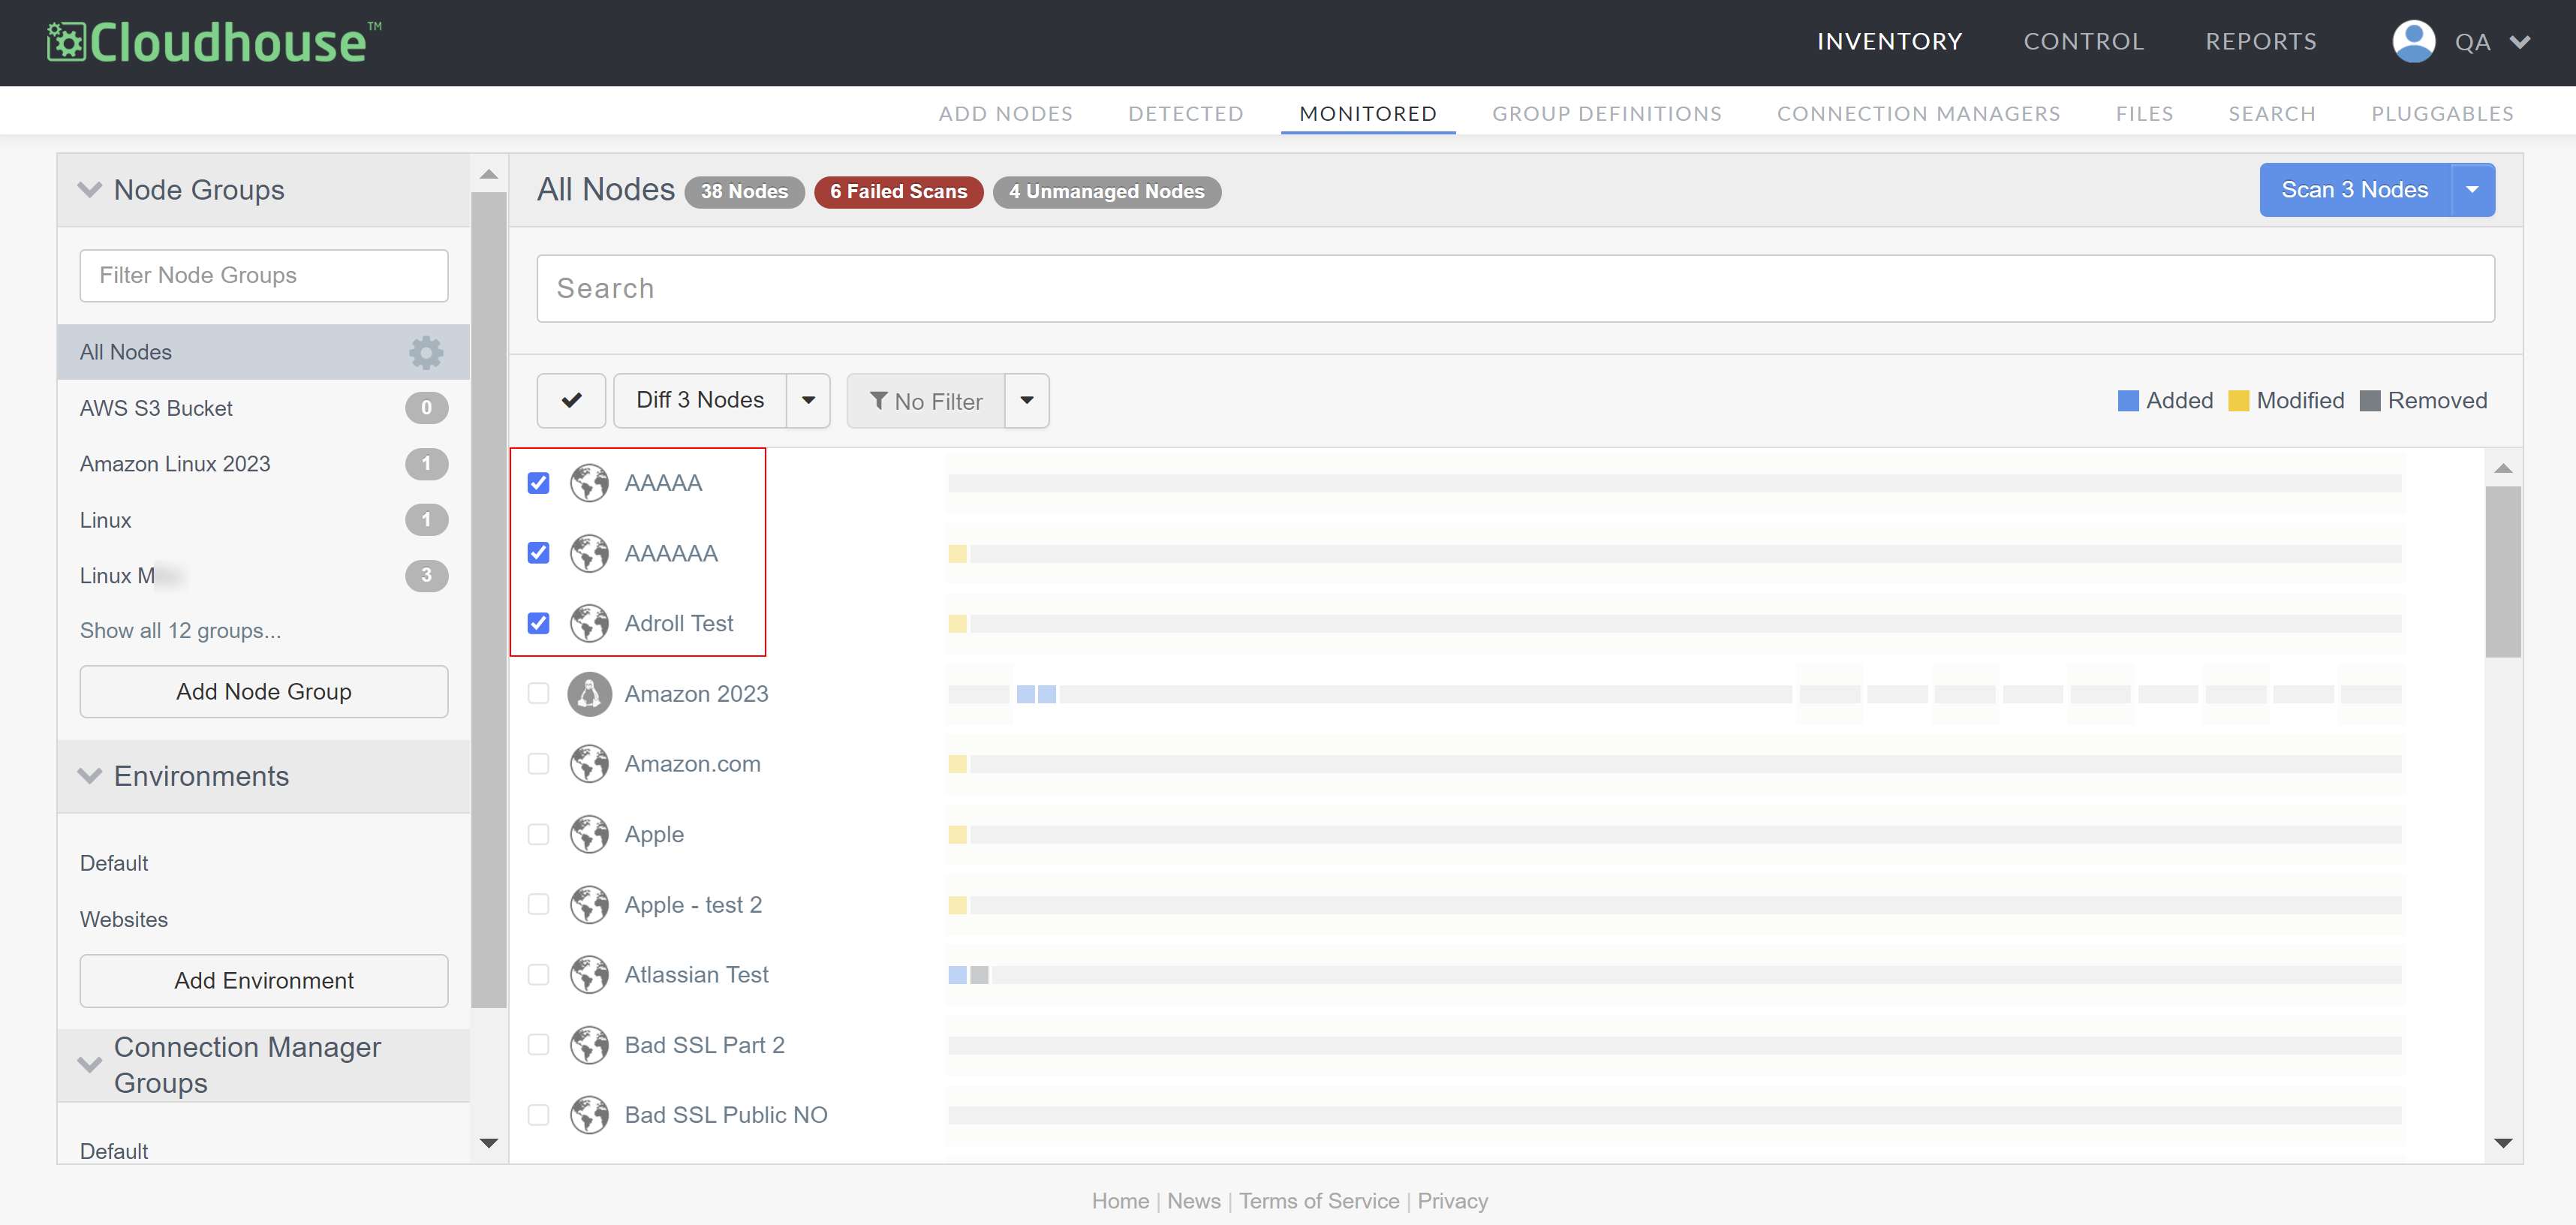
Select the checkbox of each node you want to scan from the list of options.
-
Click the Scan X Nodes button.
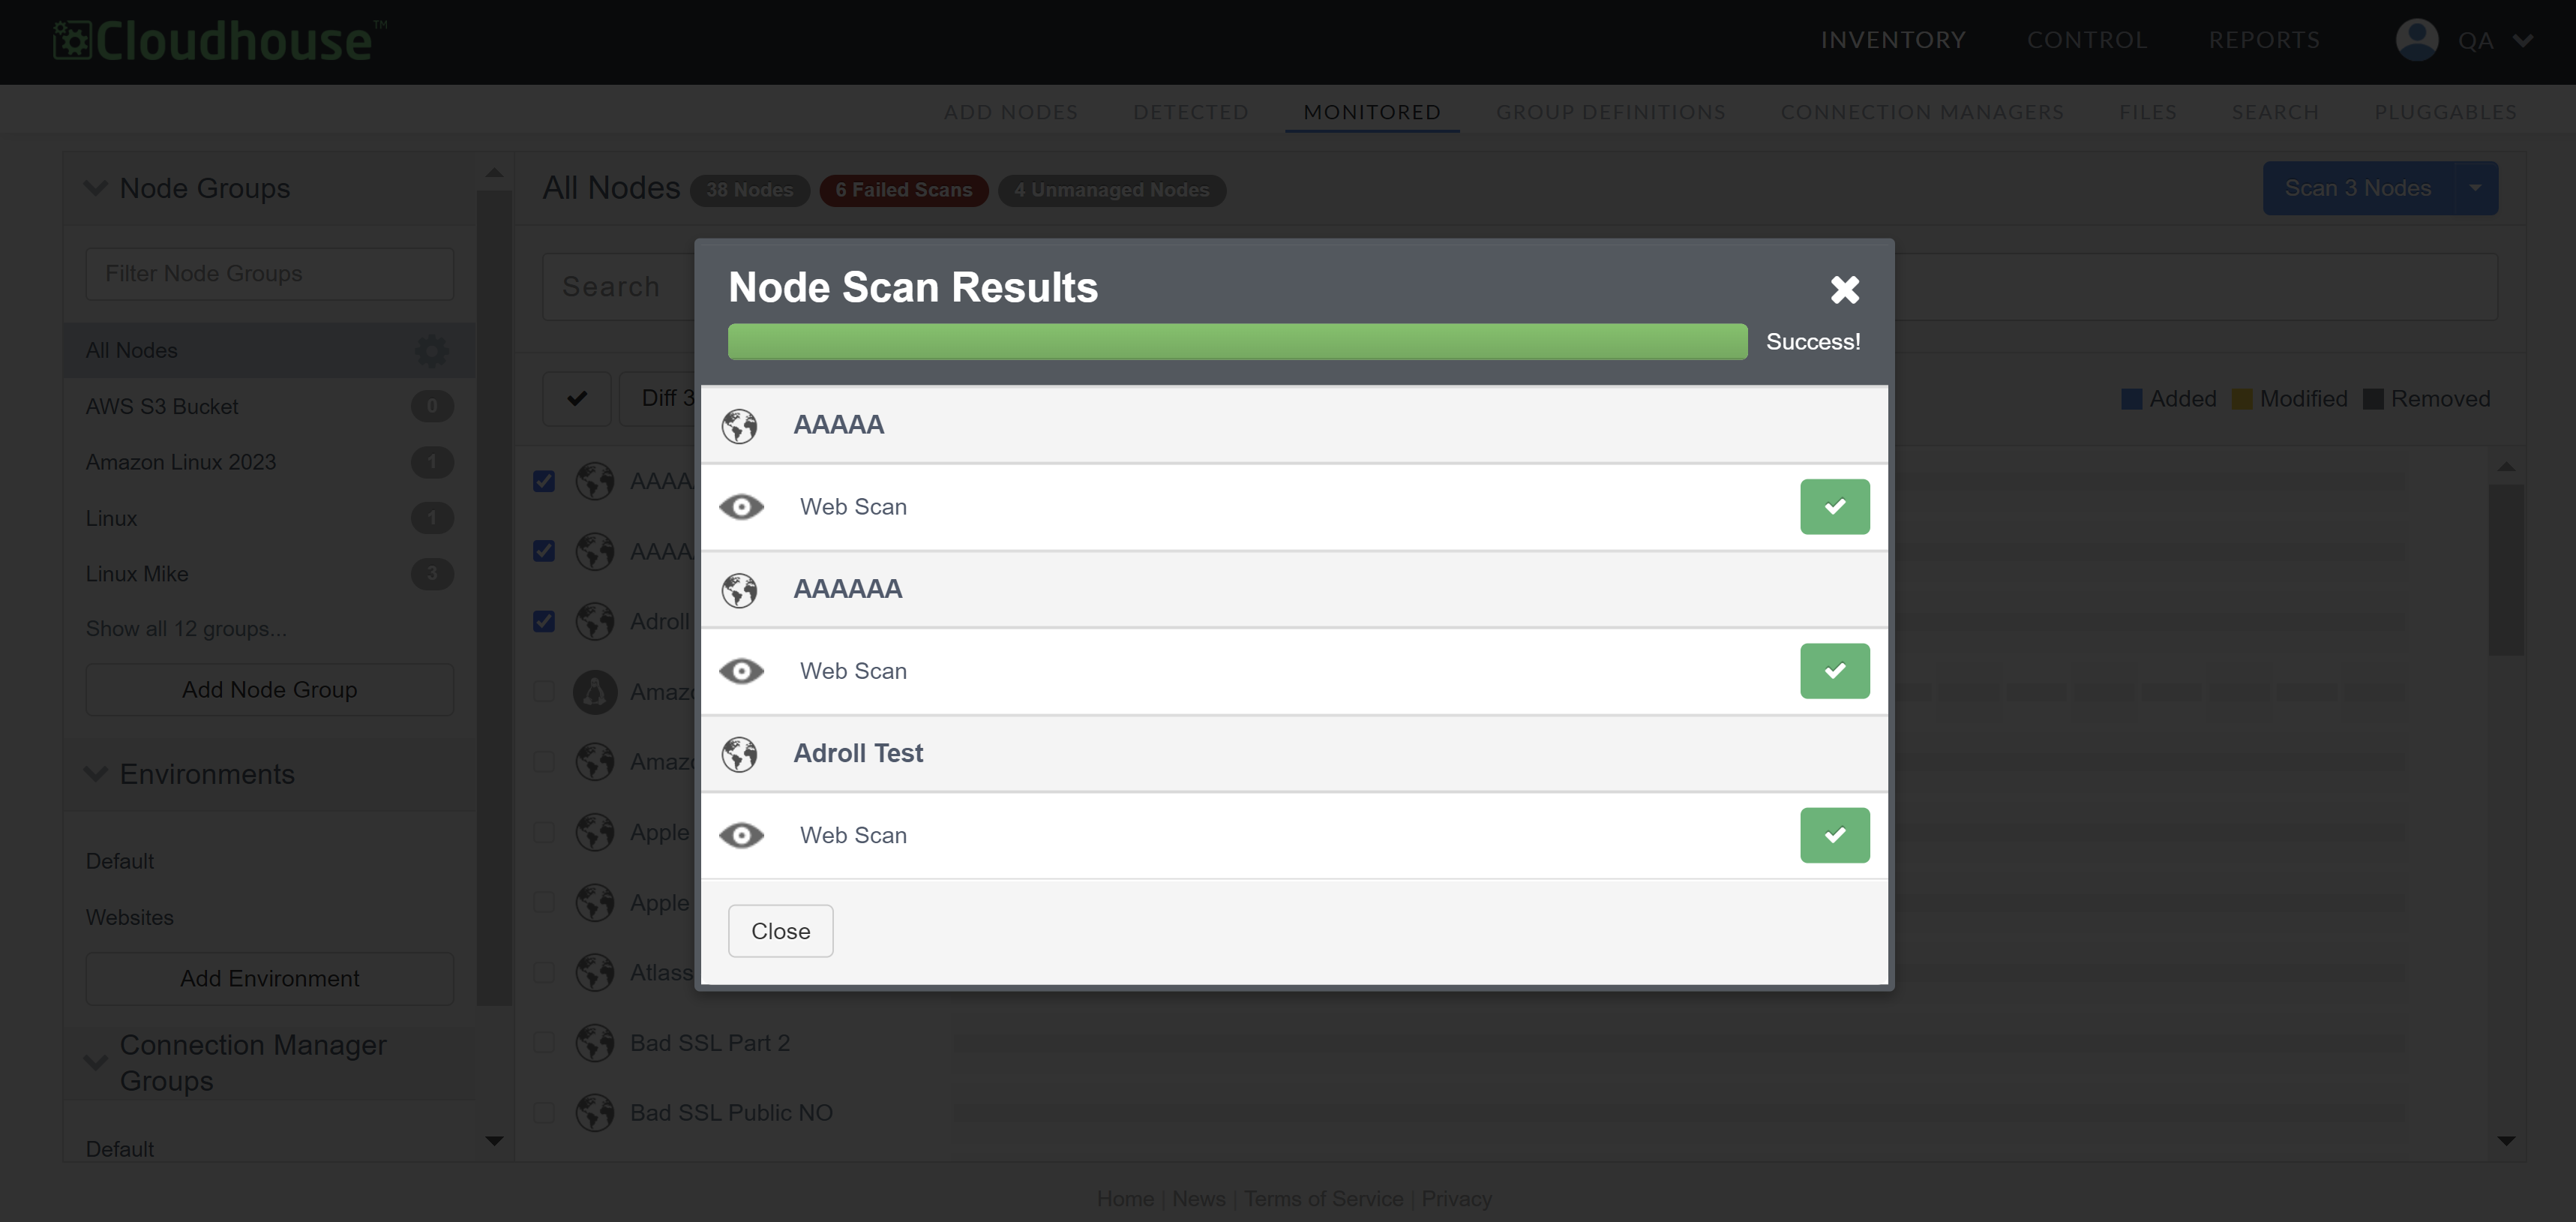
The selected nodes are then queued for scanning. Node scans duration vary depending on the complexity of the node, the operating system type, and the network quality between the Guardian appliance and the node itself.
Once complete, the Node Scan Results dialog is displayed. Here, you can access information about the nodes, including whether any errors were detected during the scan. To access the task log for the node, click anywhere on the node's row. You can use the information displayed here, or within the task log, to troubleshoot any configuration errors preventing your nodes from being scanned.
Node Group Scan
To trigger a manual scan of a node group, complete the following steps:
-
In the Guardian web application, navigate to the Monitored tab. By default, all currently monitored nodes are displayed in the 'All Nodes' node group.
-
In the Node Groups drop-down menu, locate the node group you want to scan. Then, click the Settings button (
 ).
).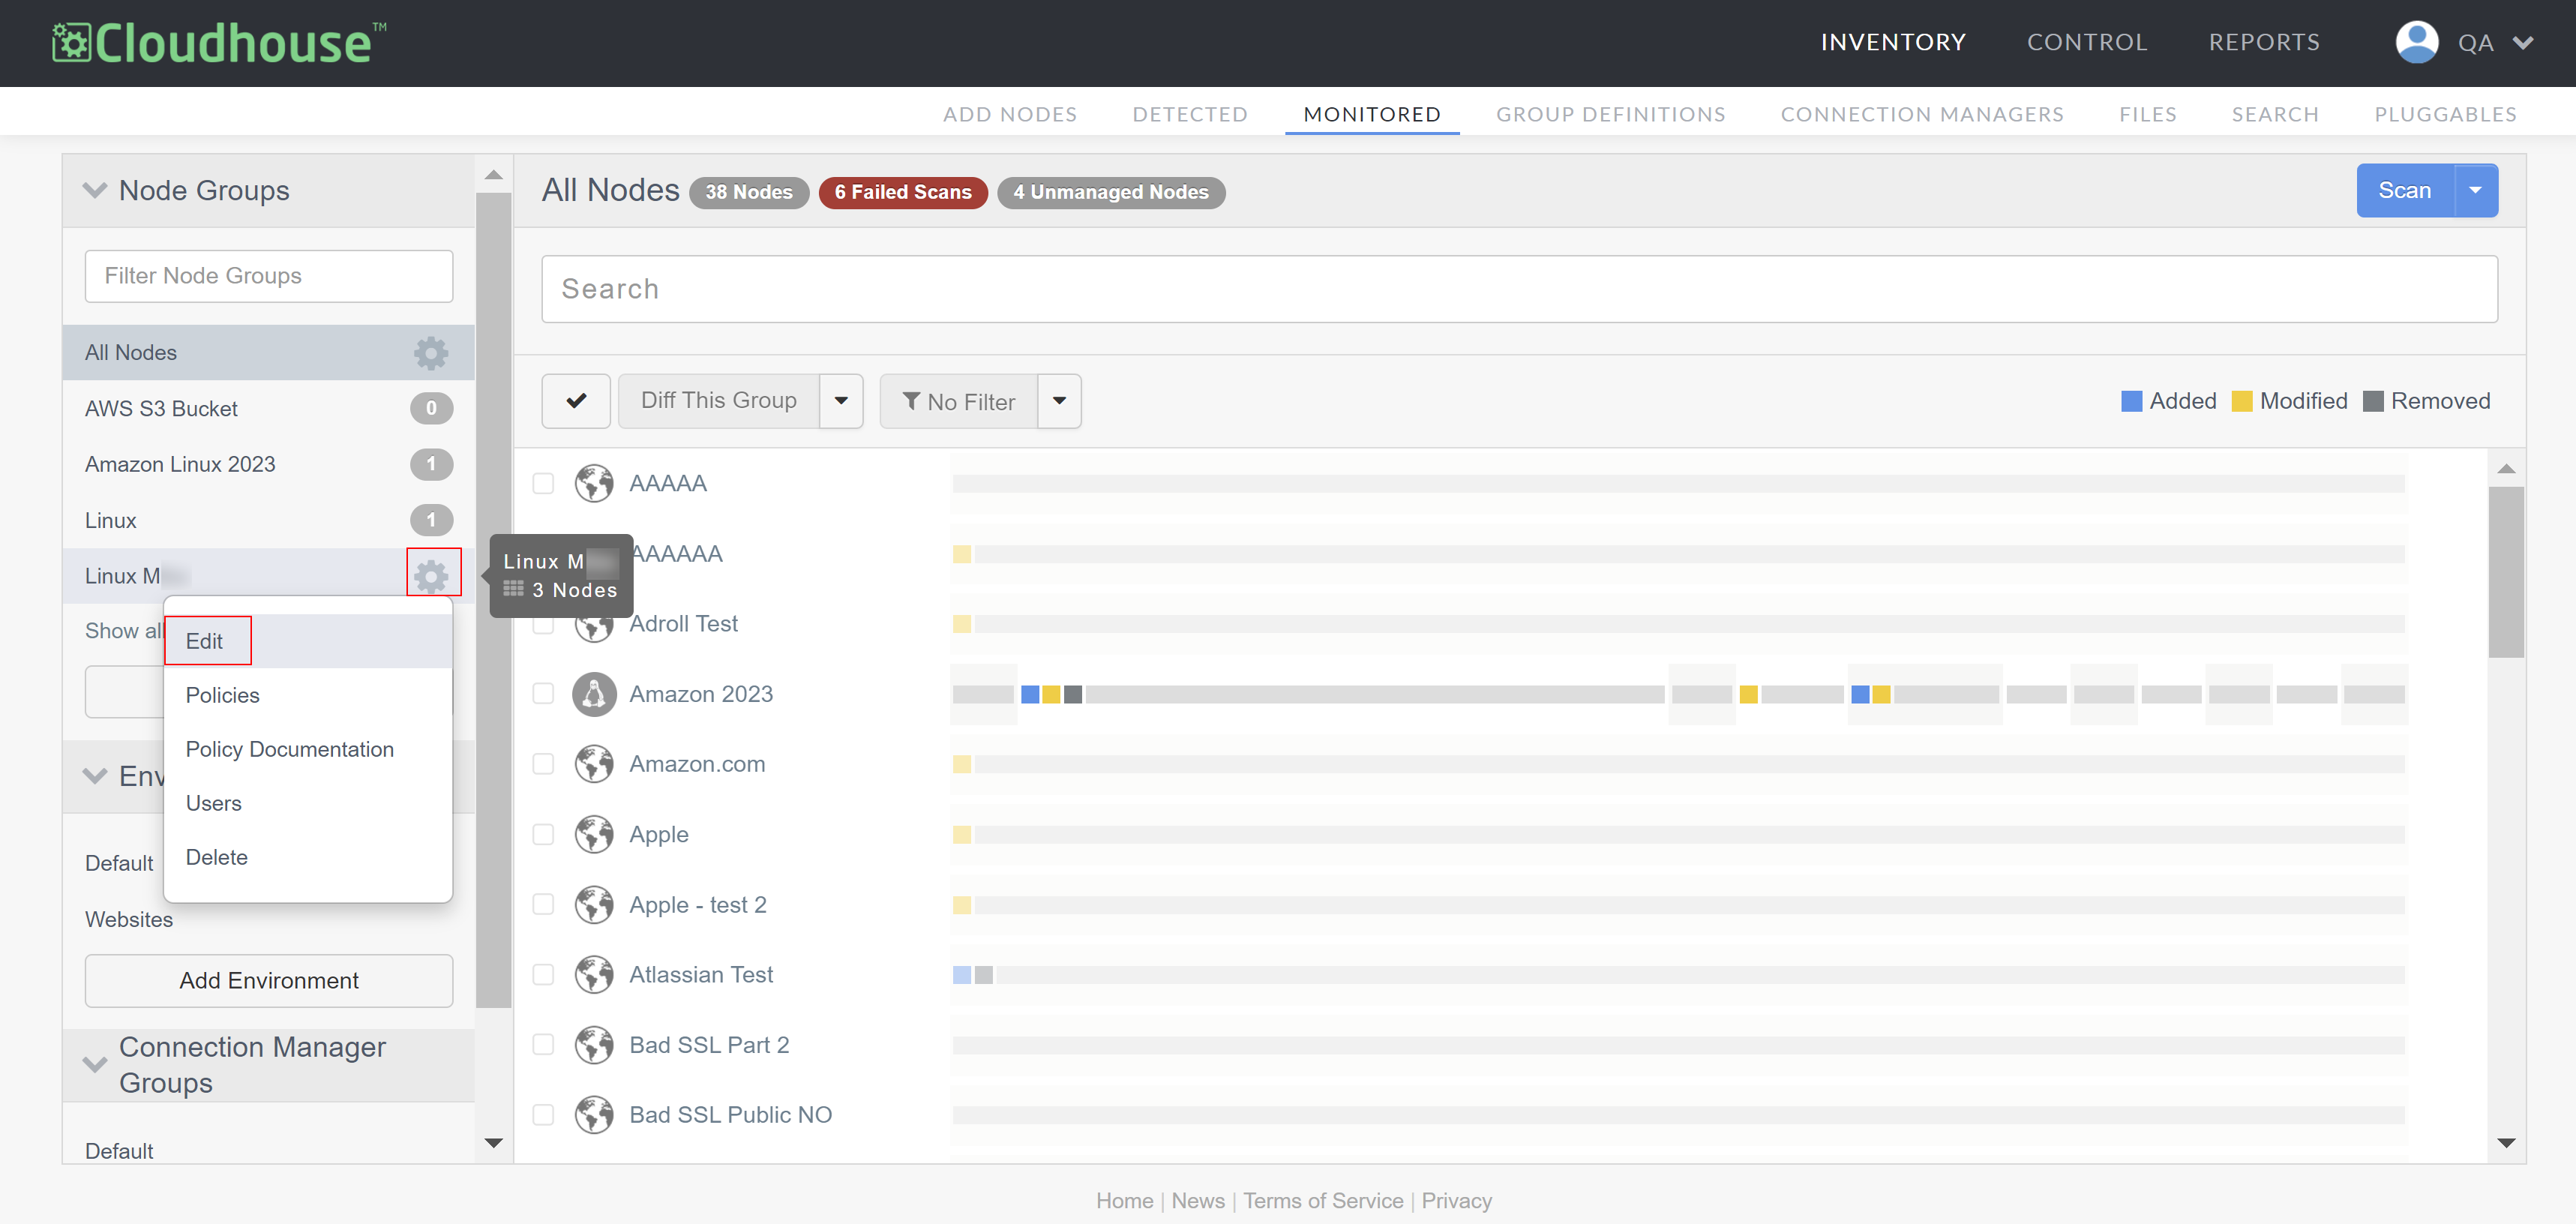
-
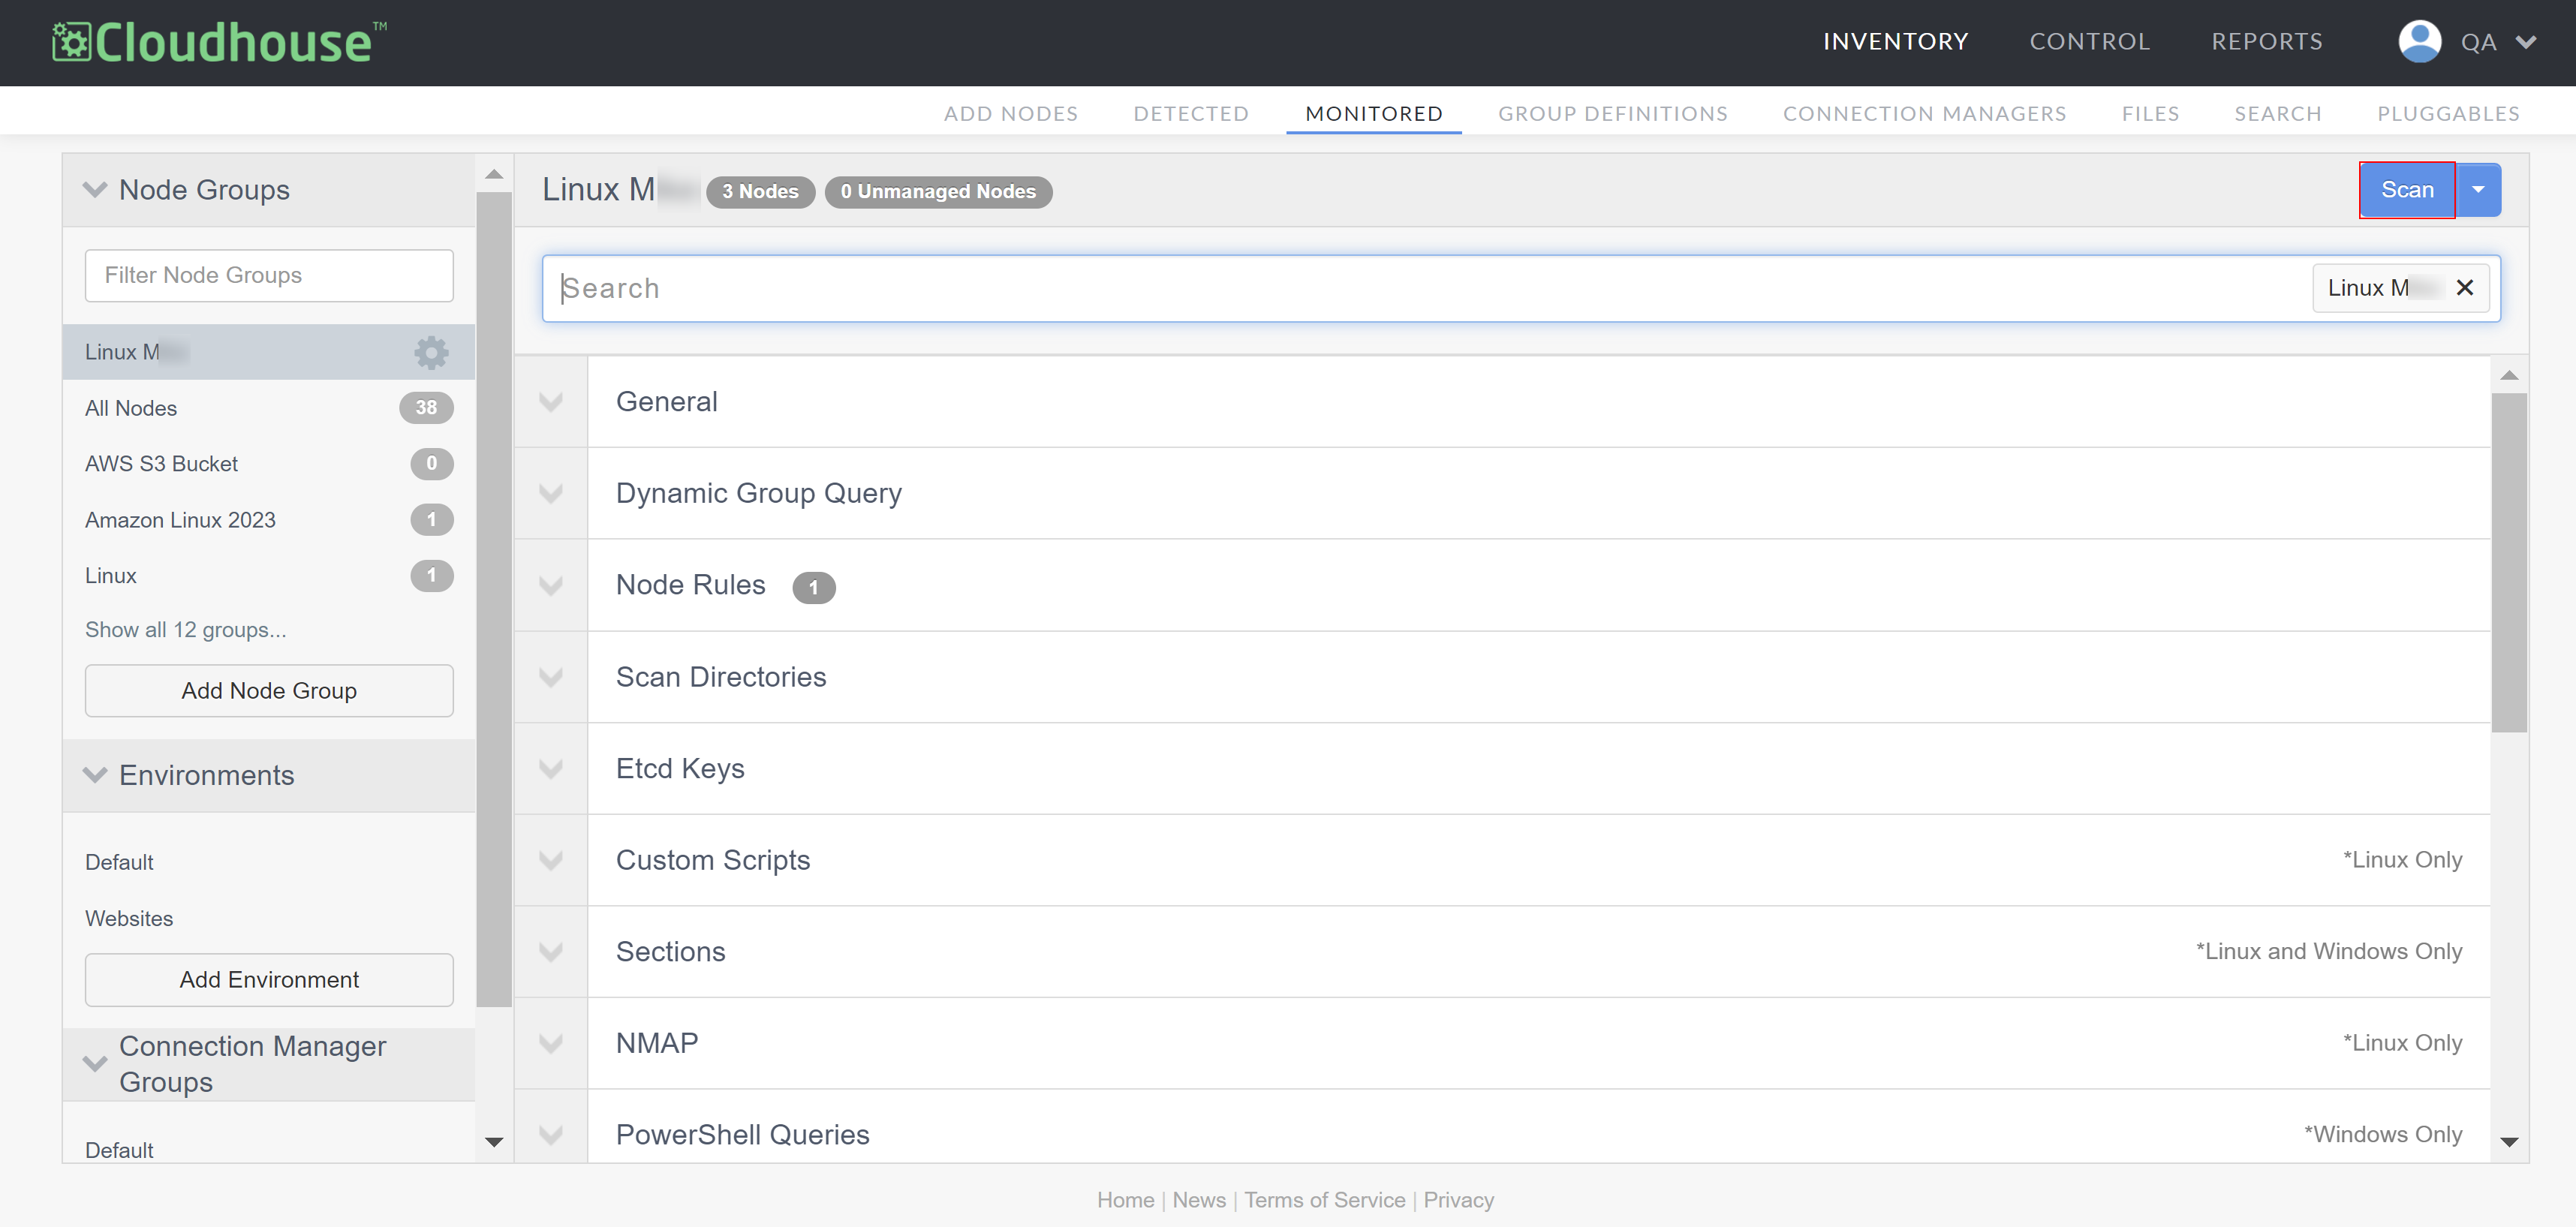
Select Edit from the list of options displayed. The node group settings page is displayed.
-
Click the Scan button.
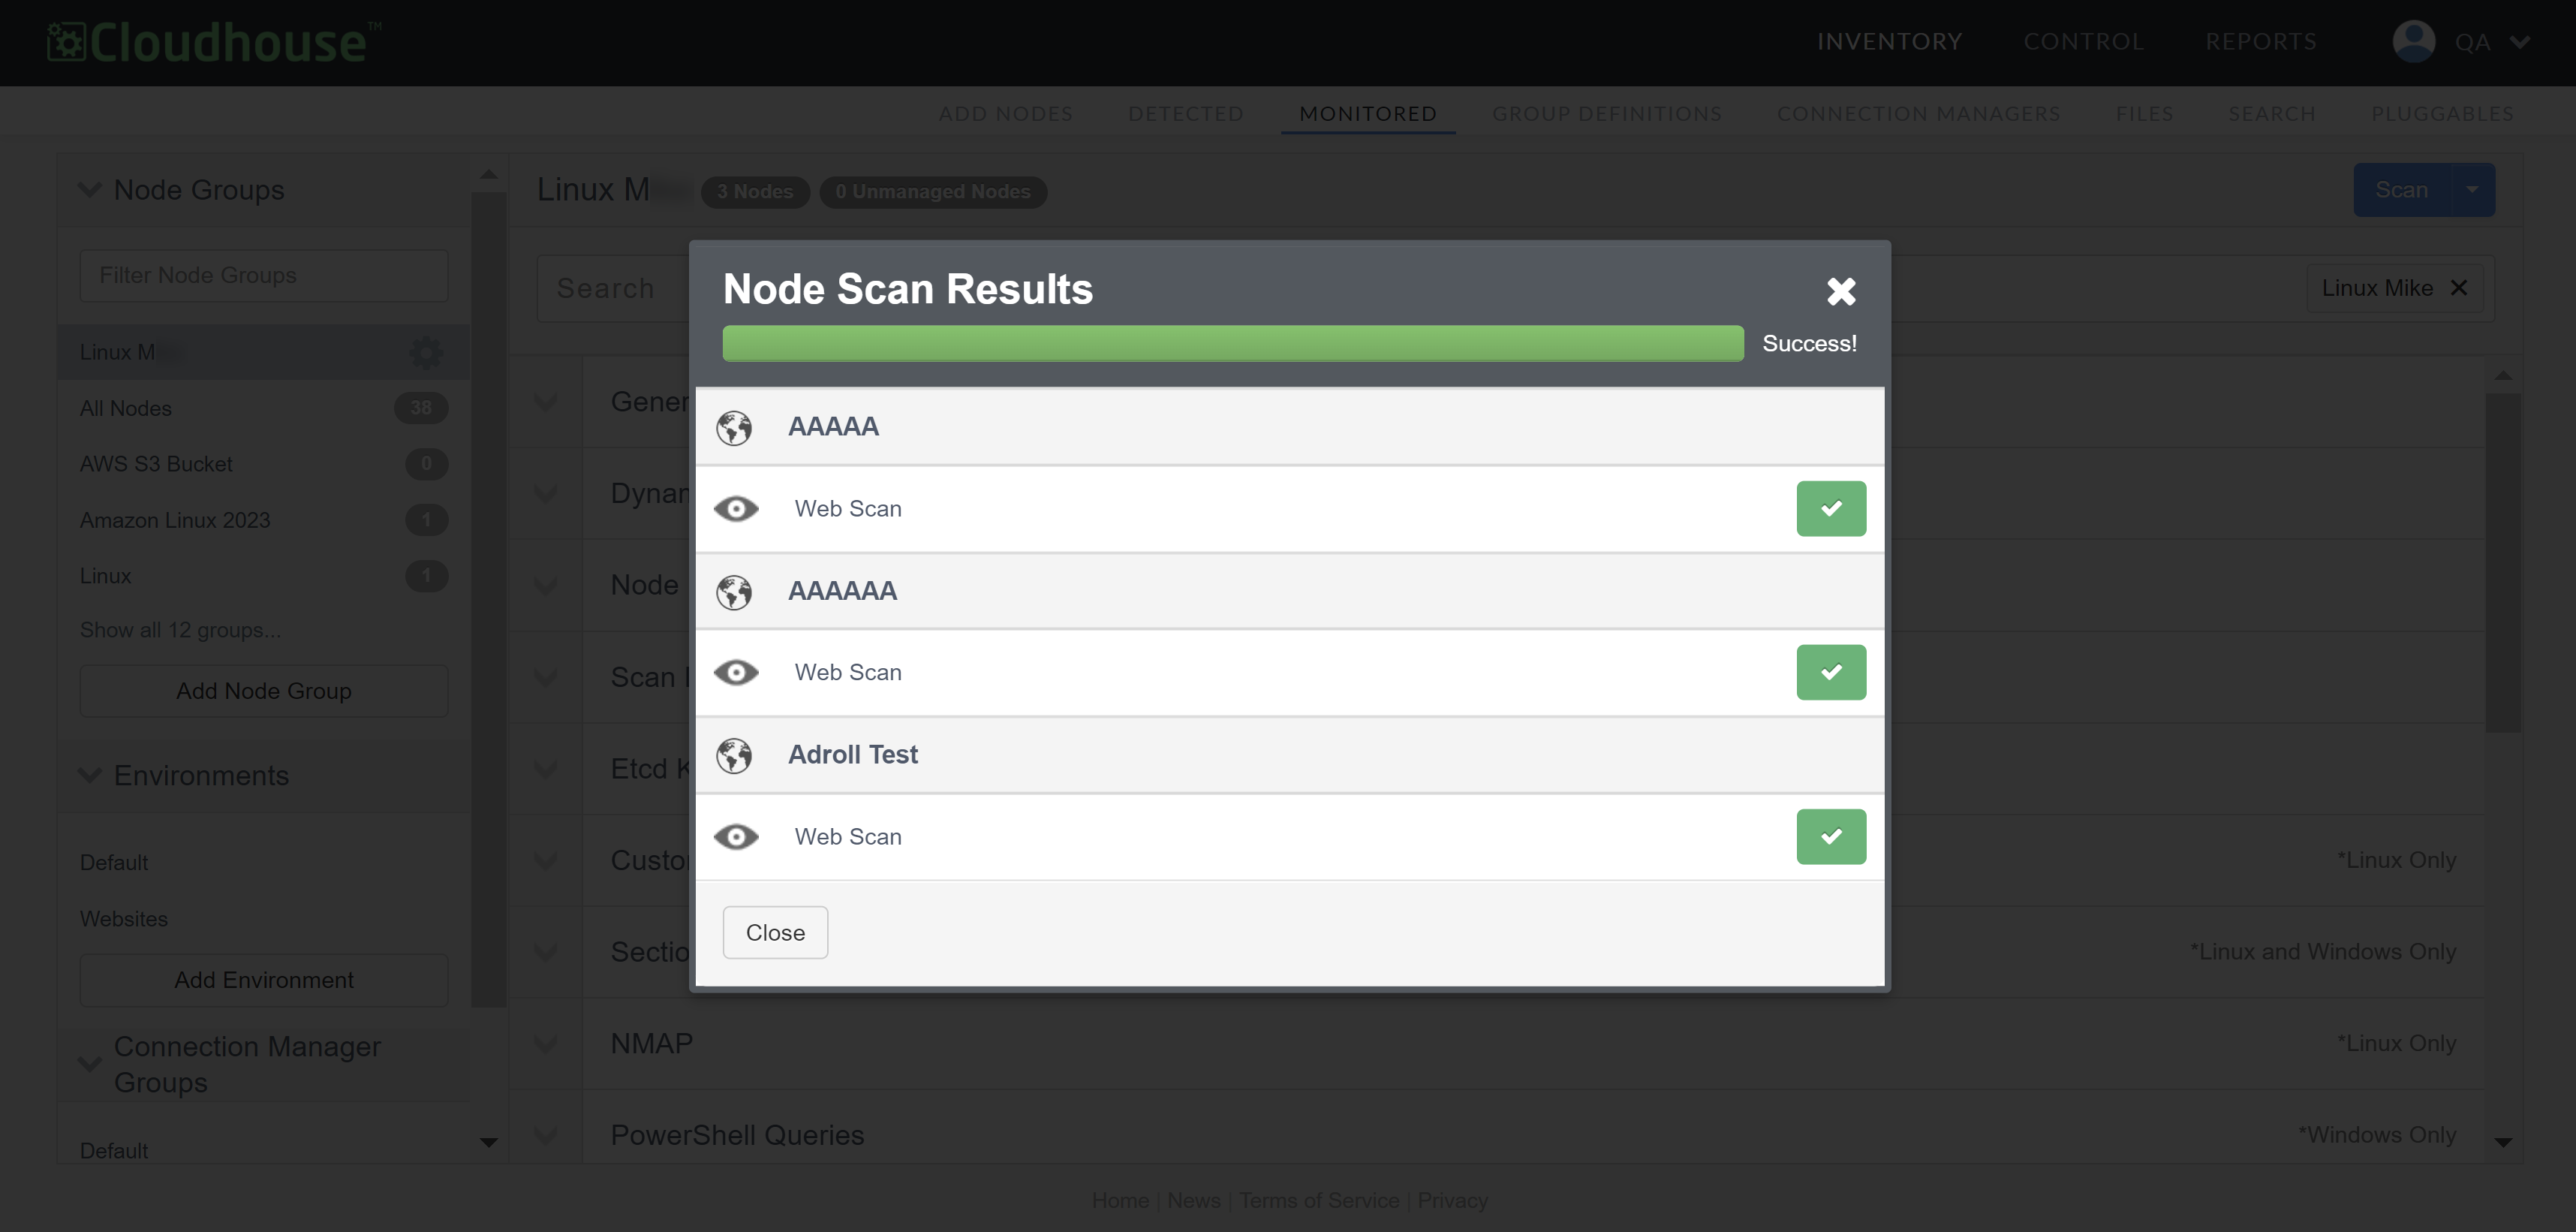
The node group is then queued for scanning. Node scans duration vary depending on the complexity of the nodes, the operating system type, and the network quality between the Guardian appliance and the node group itself.
Once complete, the Node Scan Results dialog is displayed. Here, you can access information about the nodes, including whether any errors were detected during the scan. To access the test log for each node, click anywhere on the node's row. You can use the information displayed here, or within the test log, to troubleshoot any configuration errors preventing your nodes from being scanned.
Node Scan Results Page
To trigger a manual scan from the node scan results page, complete the following steps:
-
In the Guardian web application, navigate to the Monitored tab. By default, all currently monitored nodes are displayed in the 'All Nodes' node group.
Note: If you want to display the list of monitored nodes of a different node group, select a node group from the Node Groups drop-down menu.
-
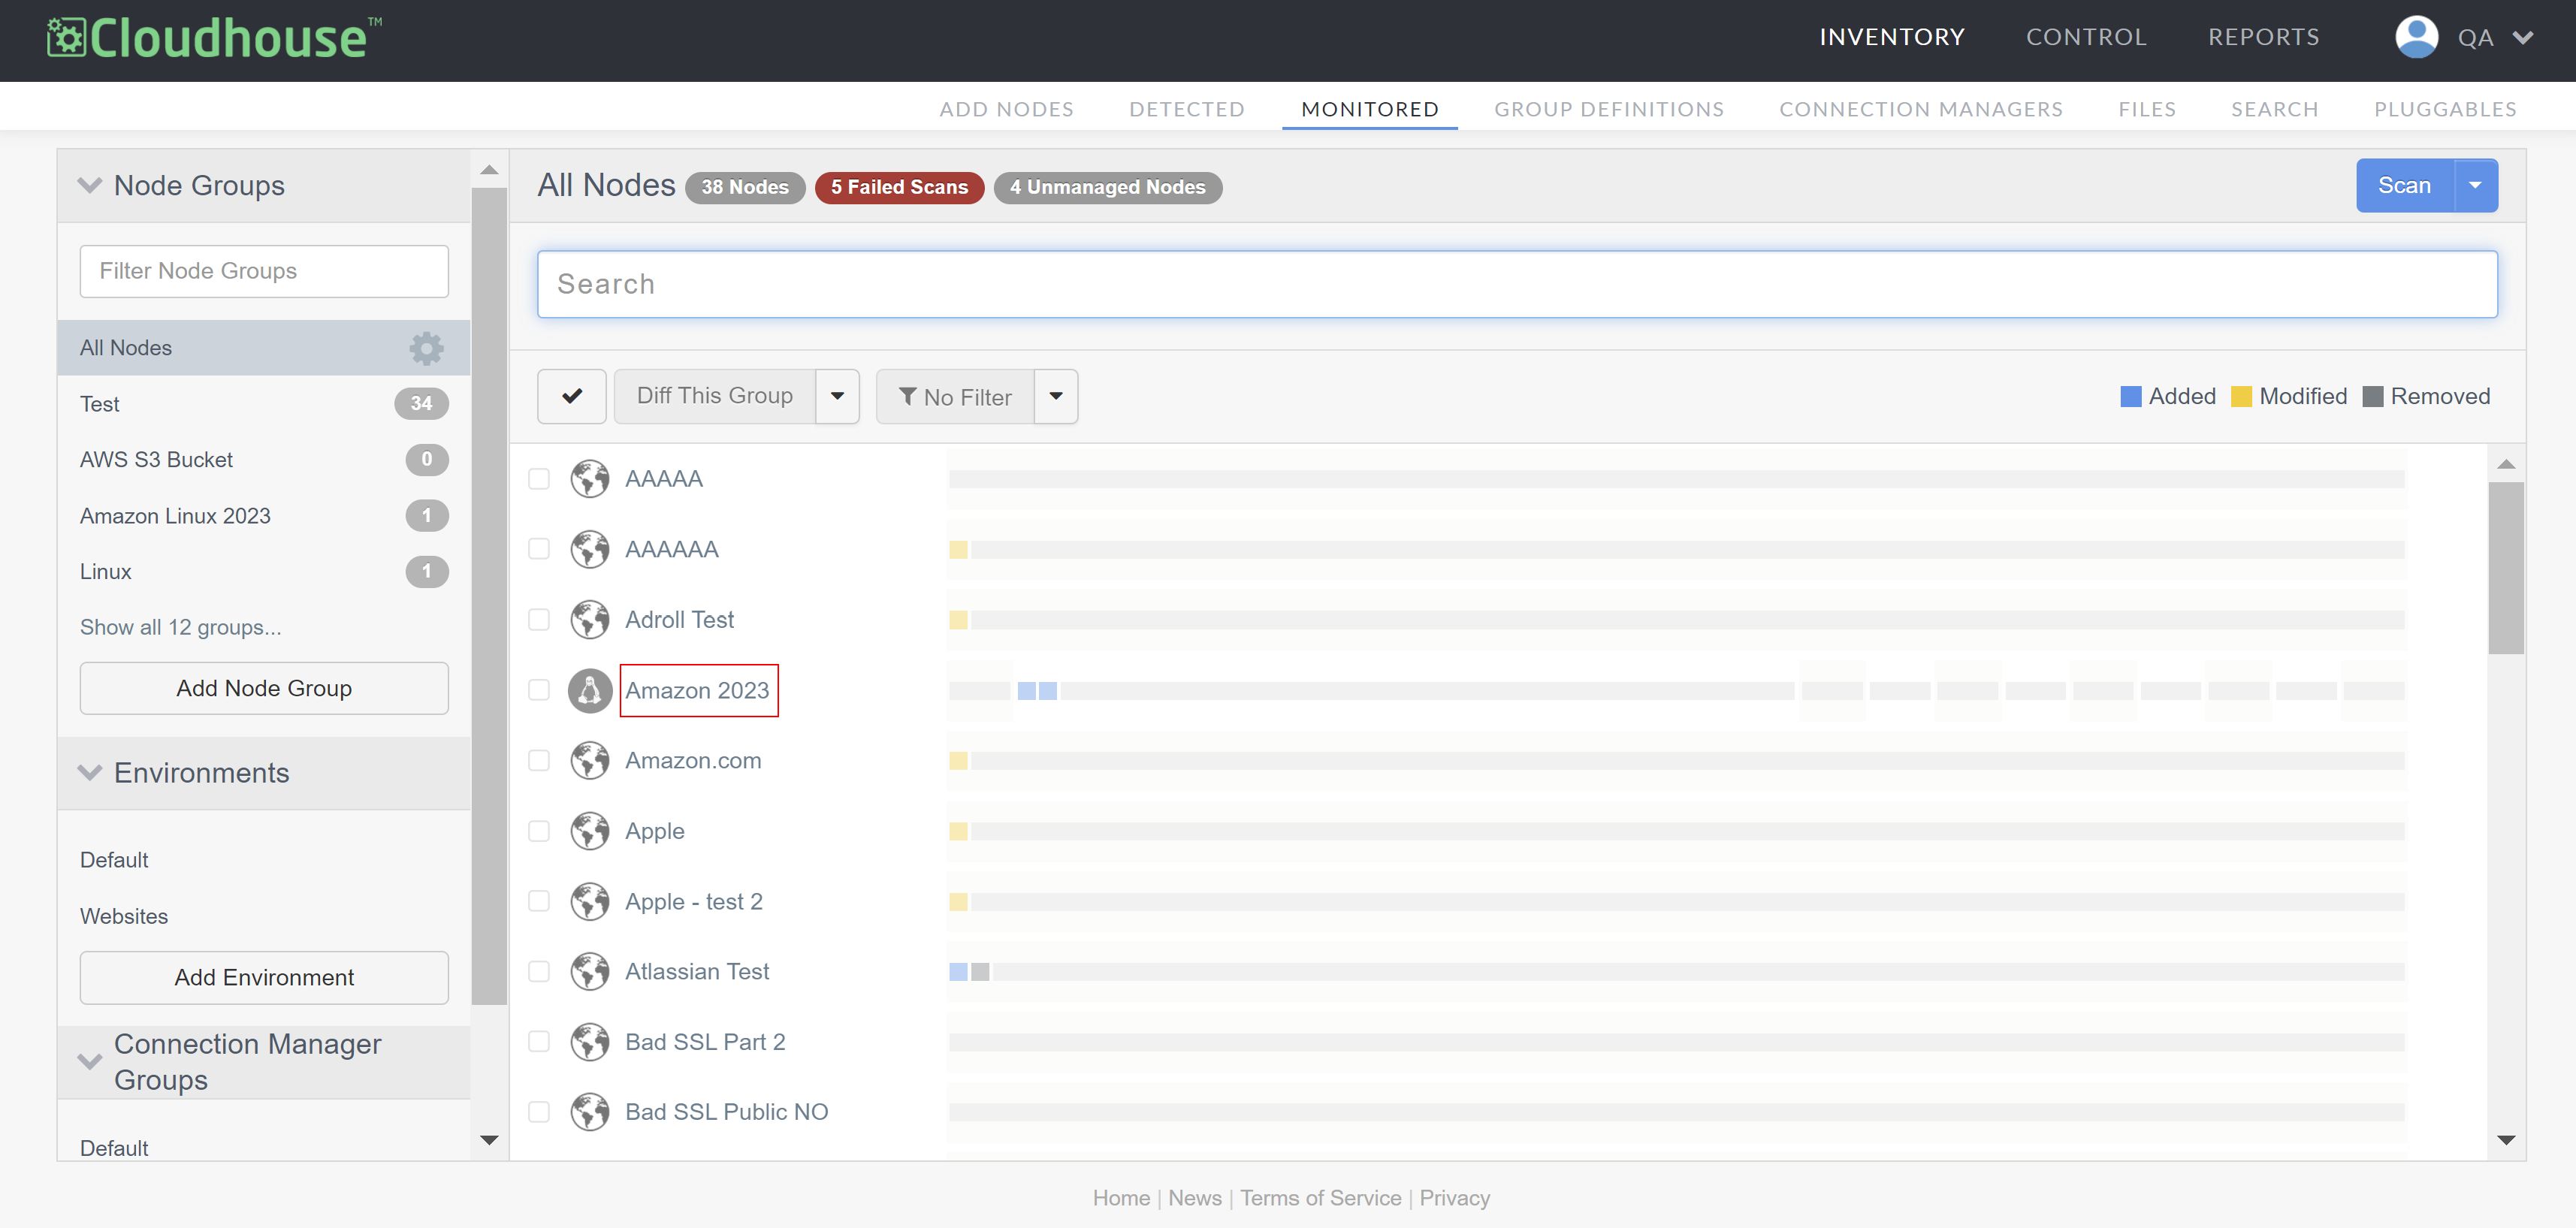
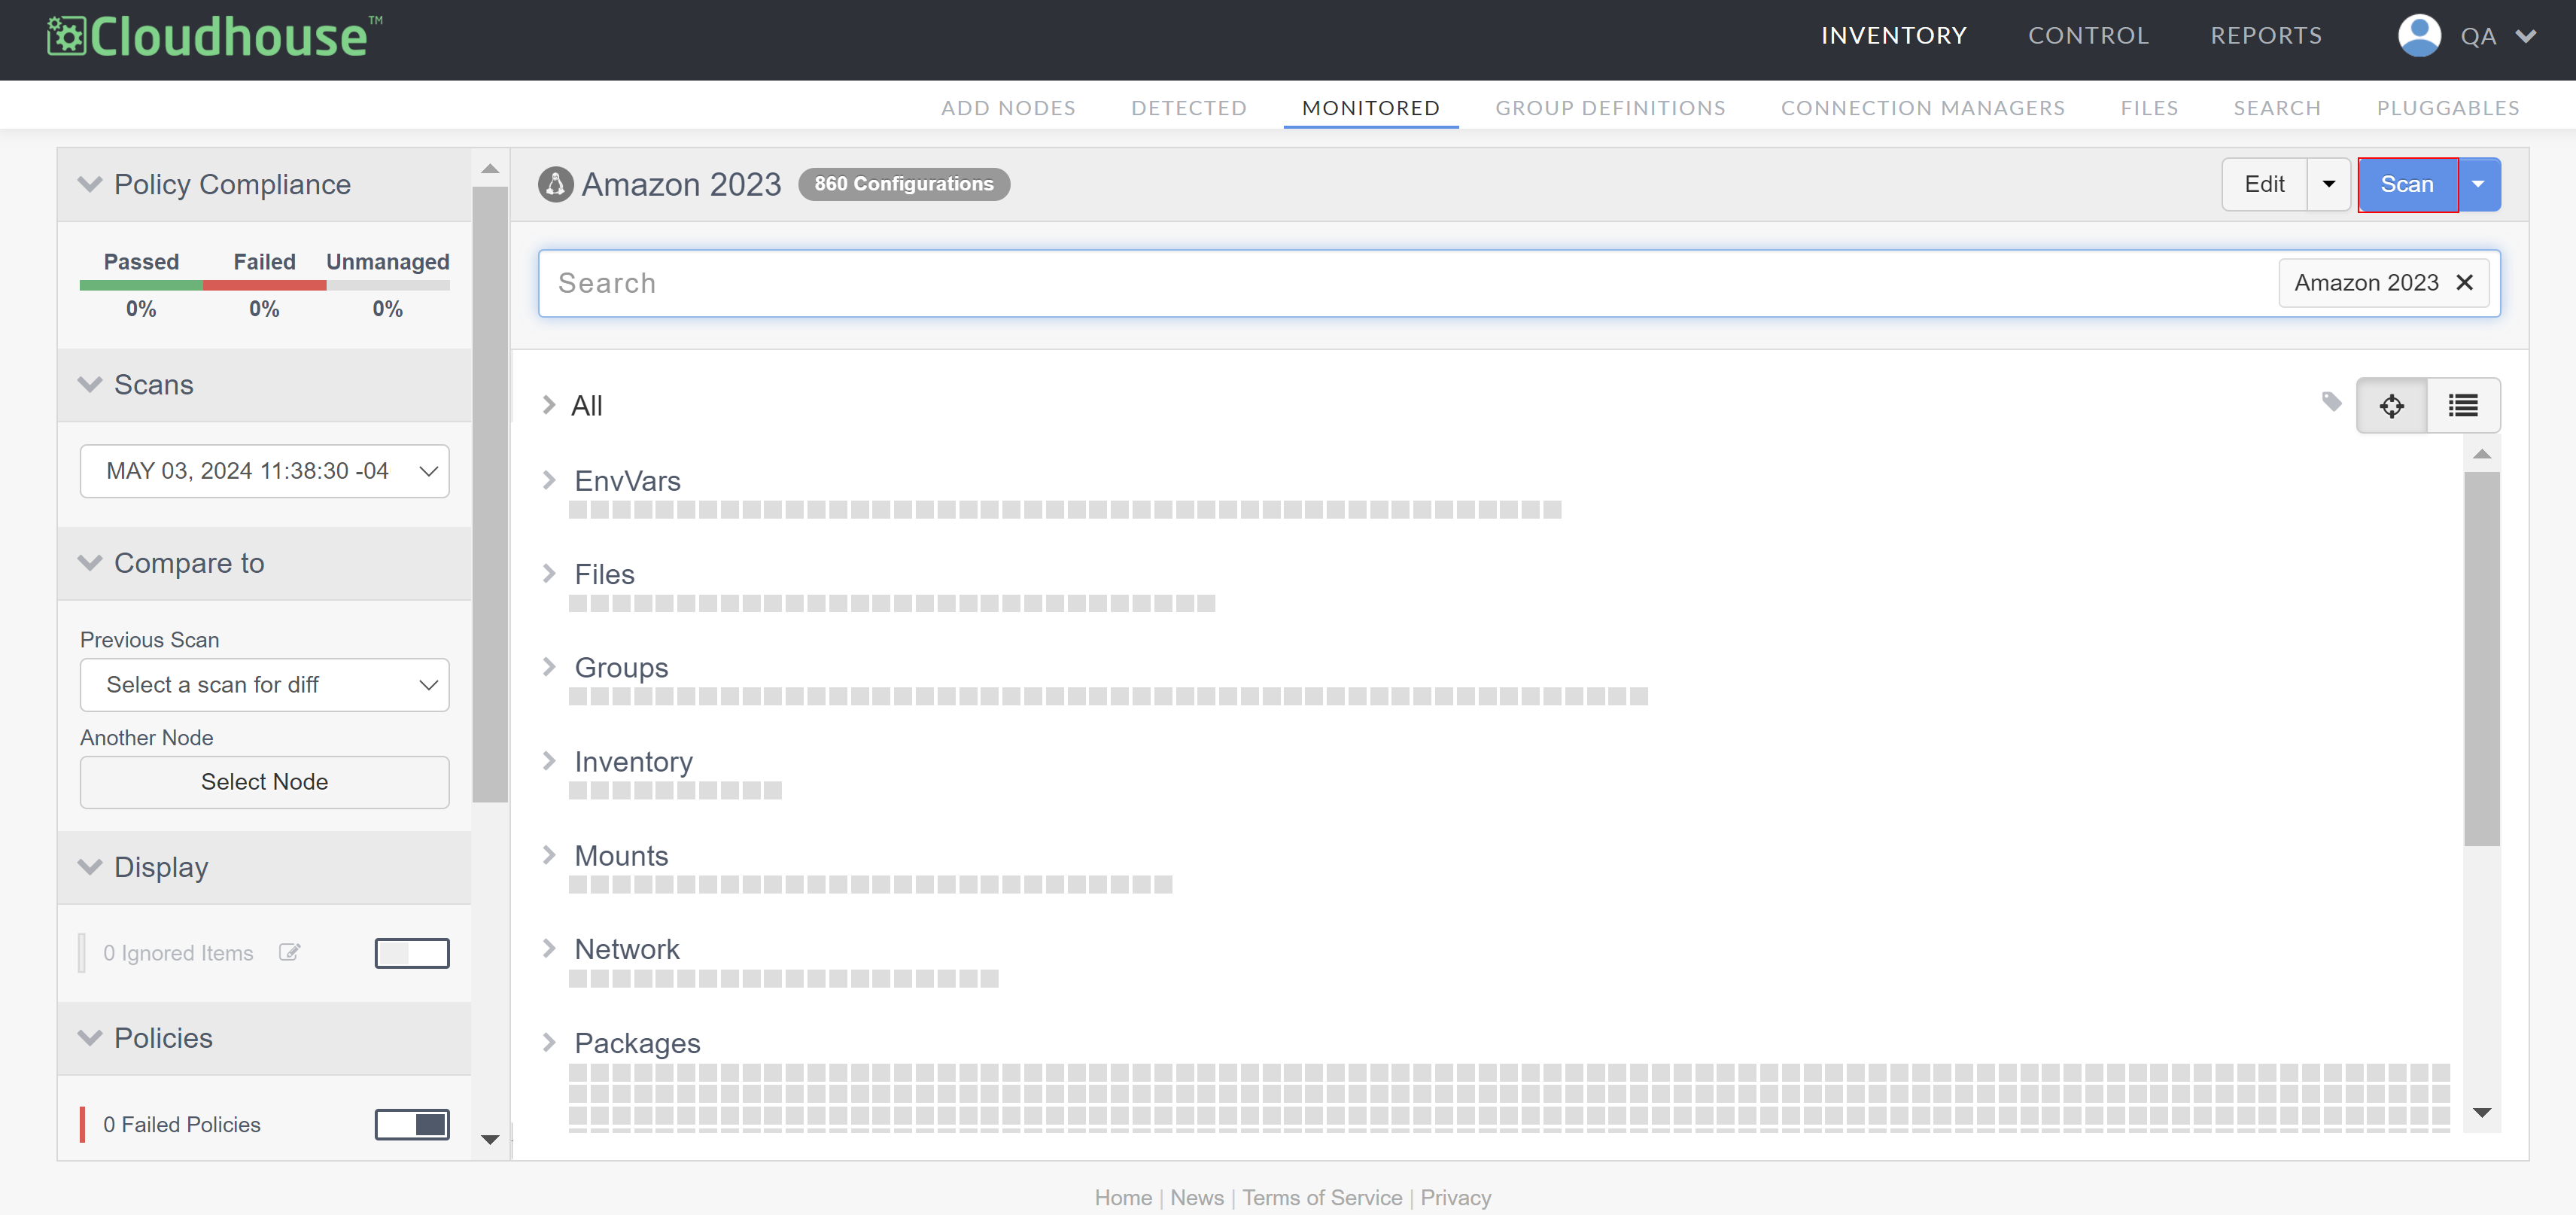
Select the node you want to scan from the list of options. The results of the node's most recent scan is displayed.
-
Click the Scan button in the top-right corner of the page to trigger a manual scan of the selected node. The Node Scan dialog is displayed and the scan is queued for processing.
-
Once complete, an overview of the Scan Results is displayed. Guardian compares the results of the current scan with the previous scan to determine whether any changes have occurred on the node in between the two scan dates. If no changes are detected, the following message is displayed, 'No differences were detected!'
-
Click the View Scan button to view the results of your scan and close the dialog.
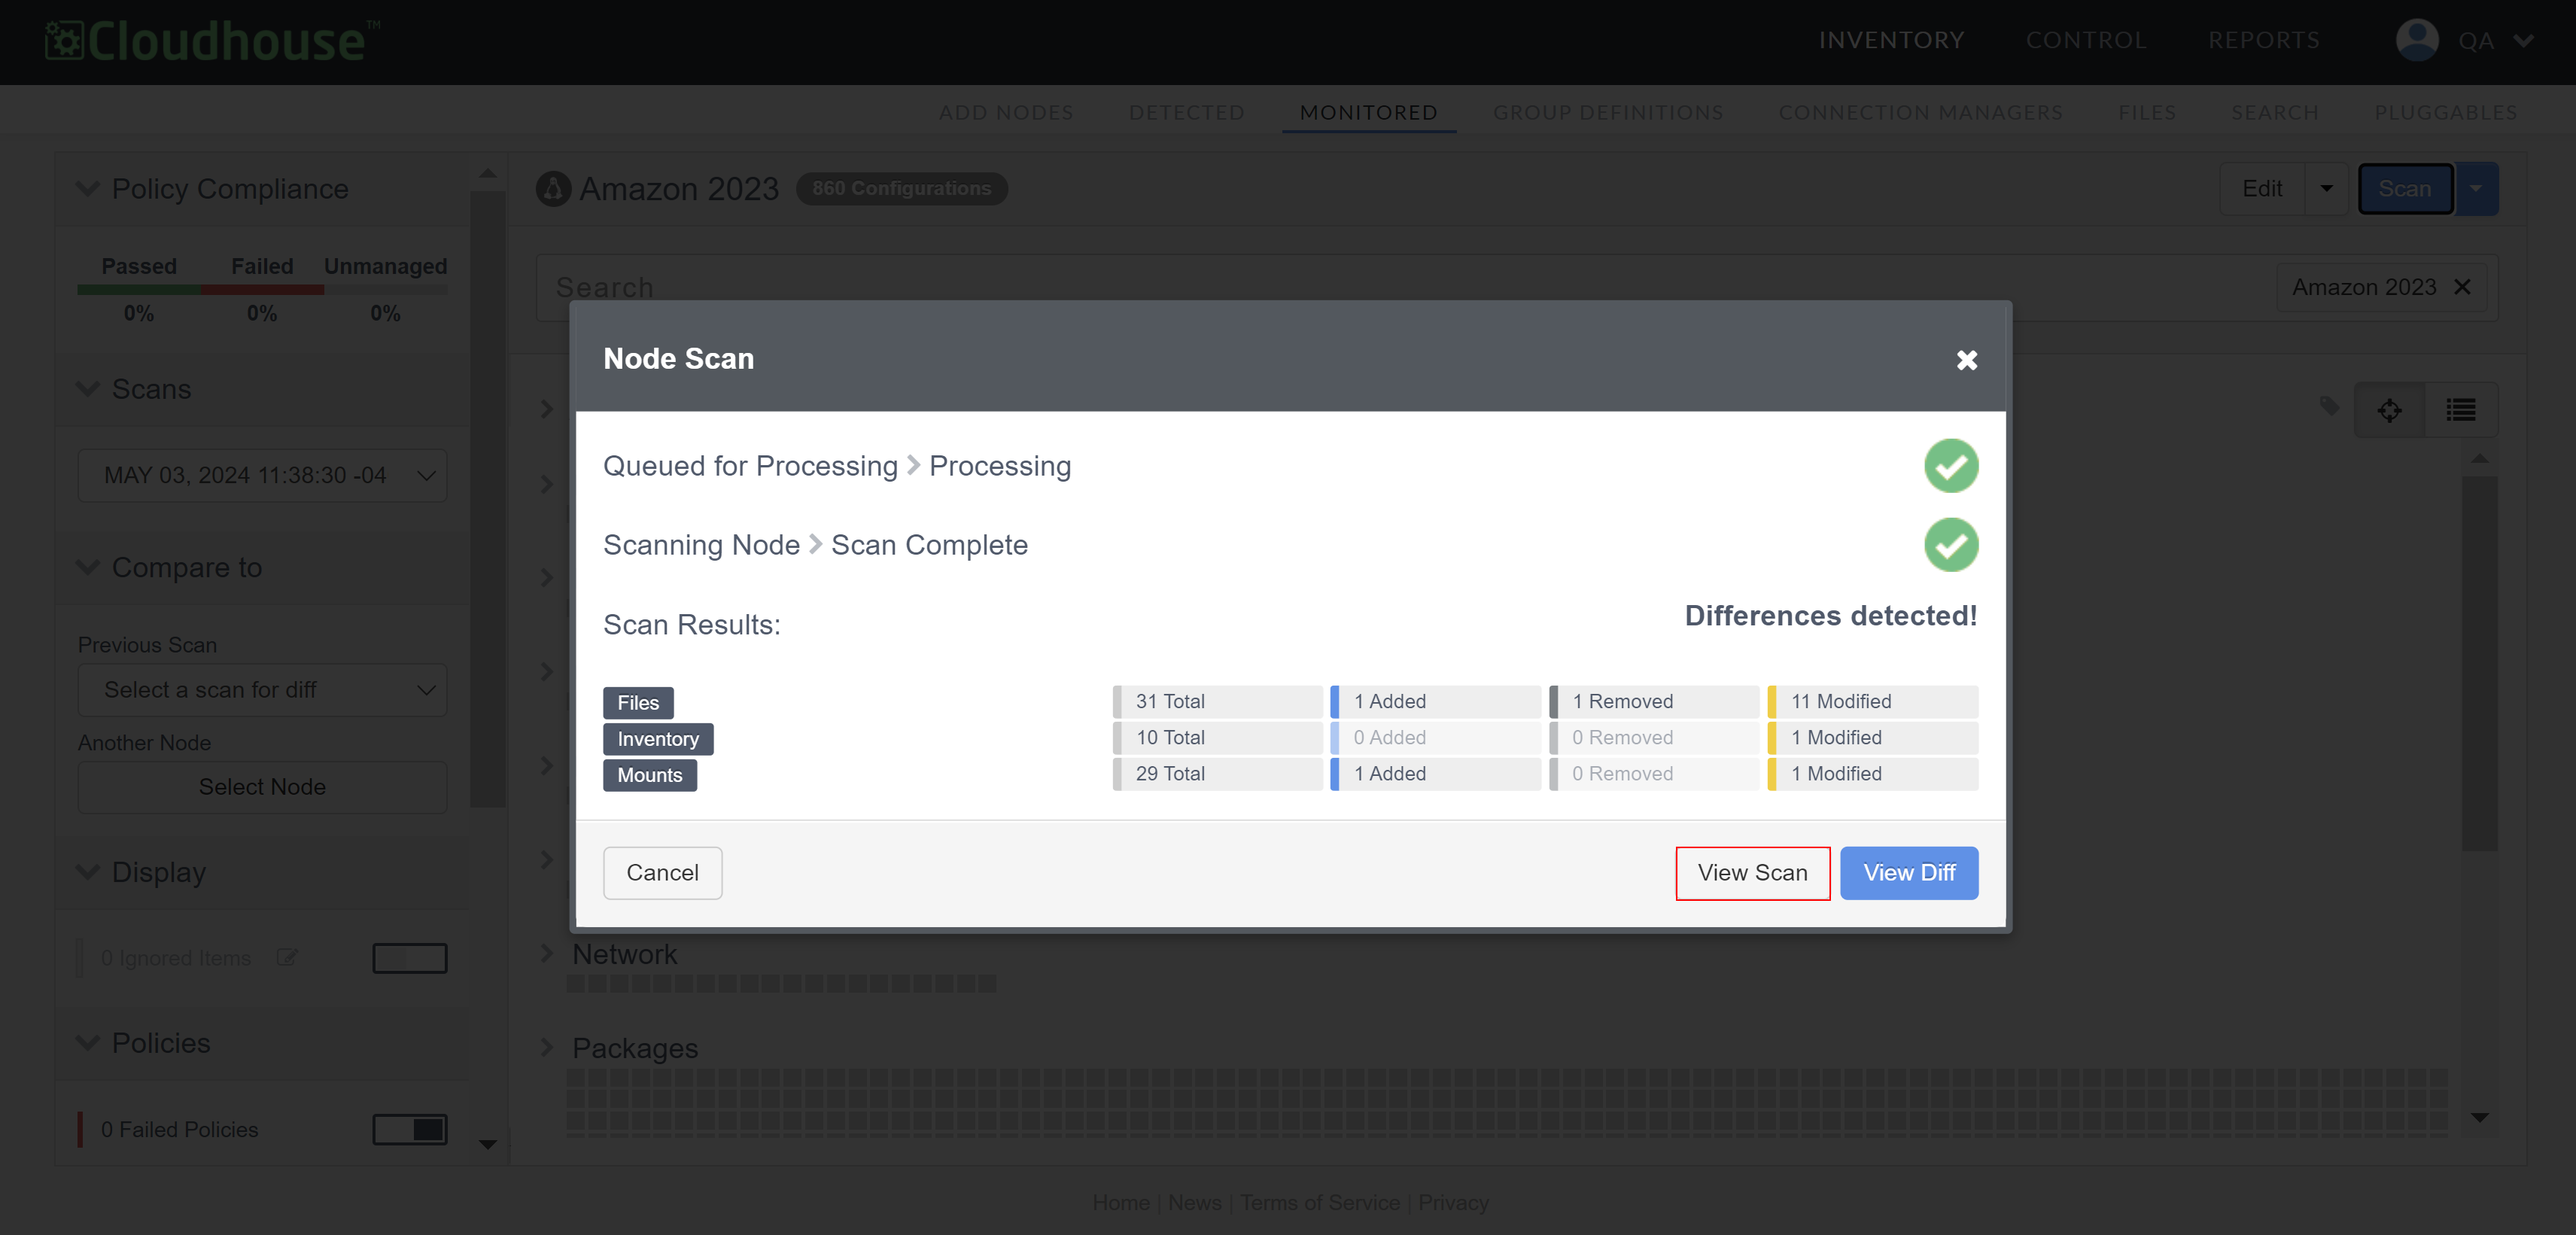
If Guardian detects any changes that occurred between the two scan dates, the following message is displayed: 'Differences detected!'. In this scenario, the following options are displayed:
| Option | Description |
|---|---|
| View Scan button |
Click to view the results of the scan. The results of the previous node scan is updated with the results of the current scan. For more information on each of the sections that are displayed, see Node Scan Results. |
| View Diff button |
Click to generate a difference report for the current and previous scan of the same node. The node scan results are updated to reflect the configuration items that have been added, removed, and modified between the two scan dates. For more information, see Scan Differencing. |
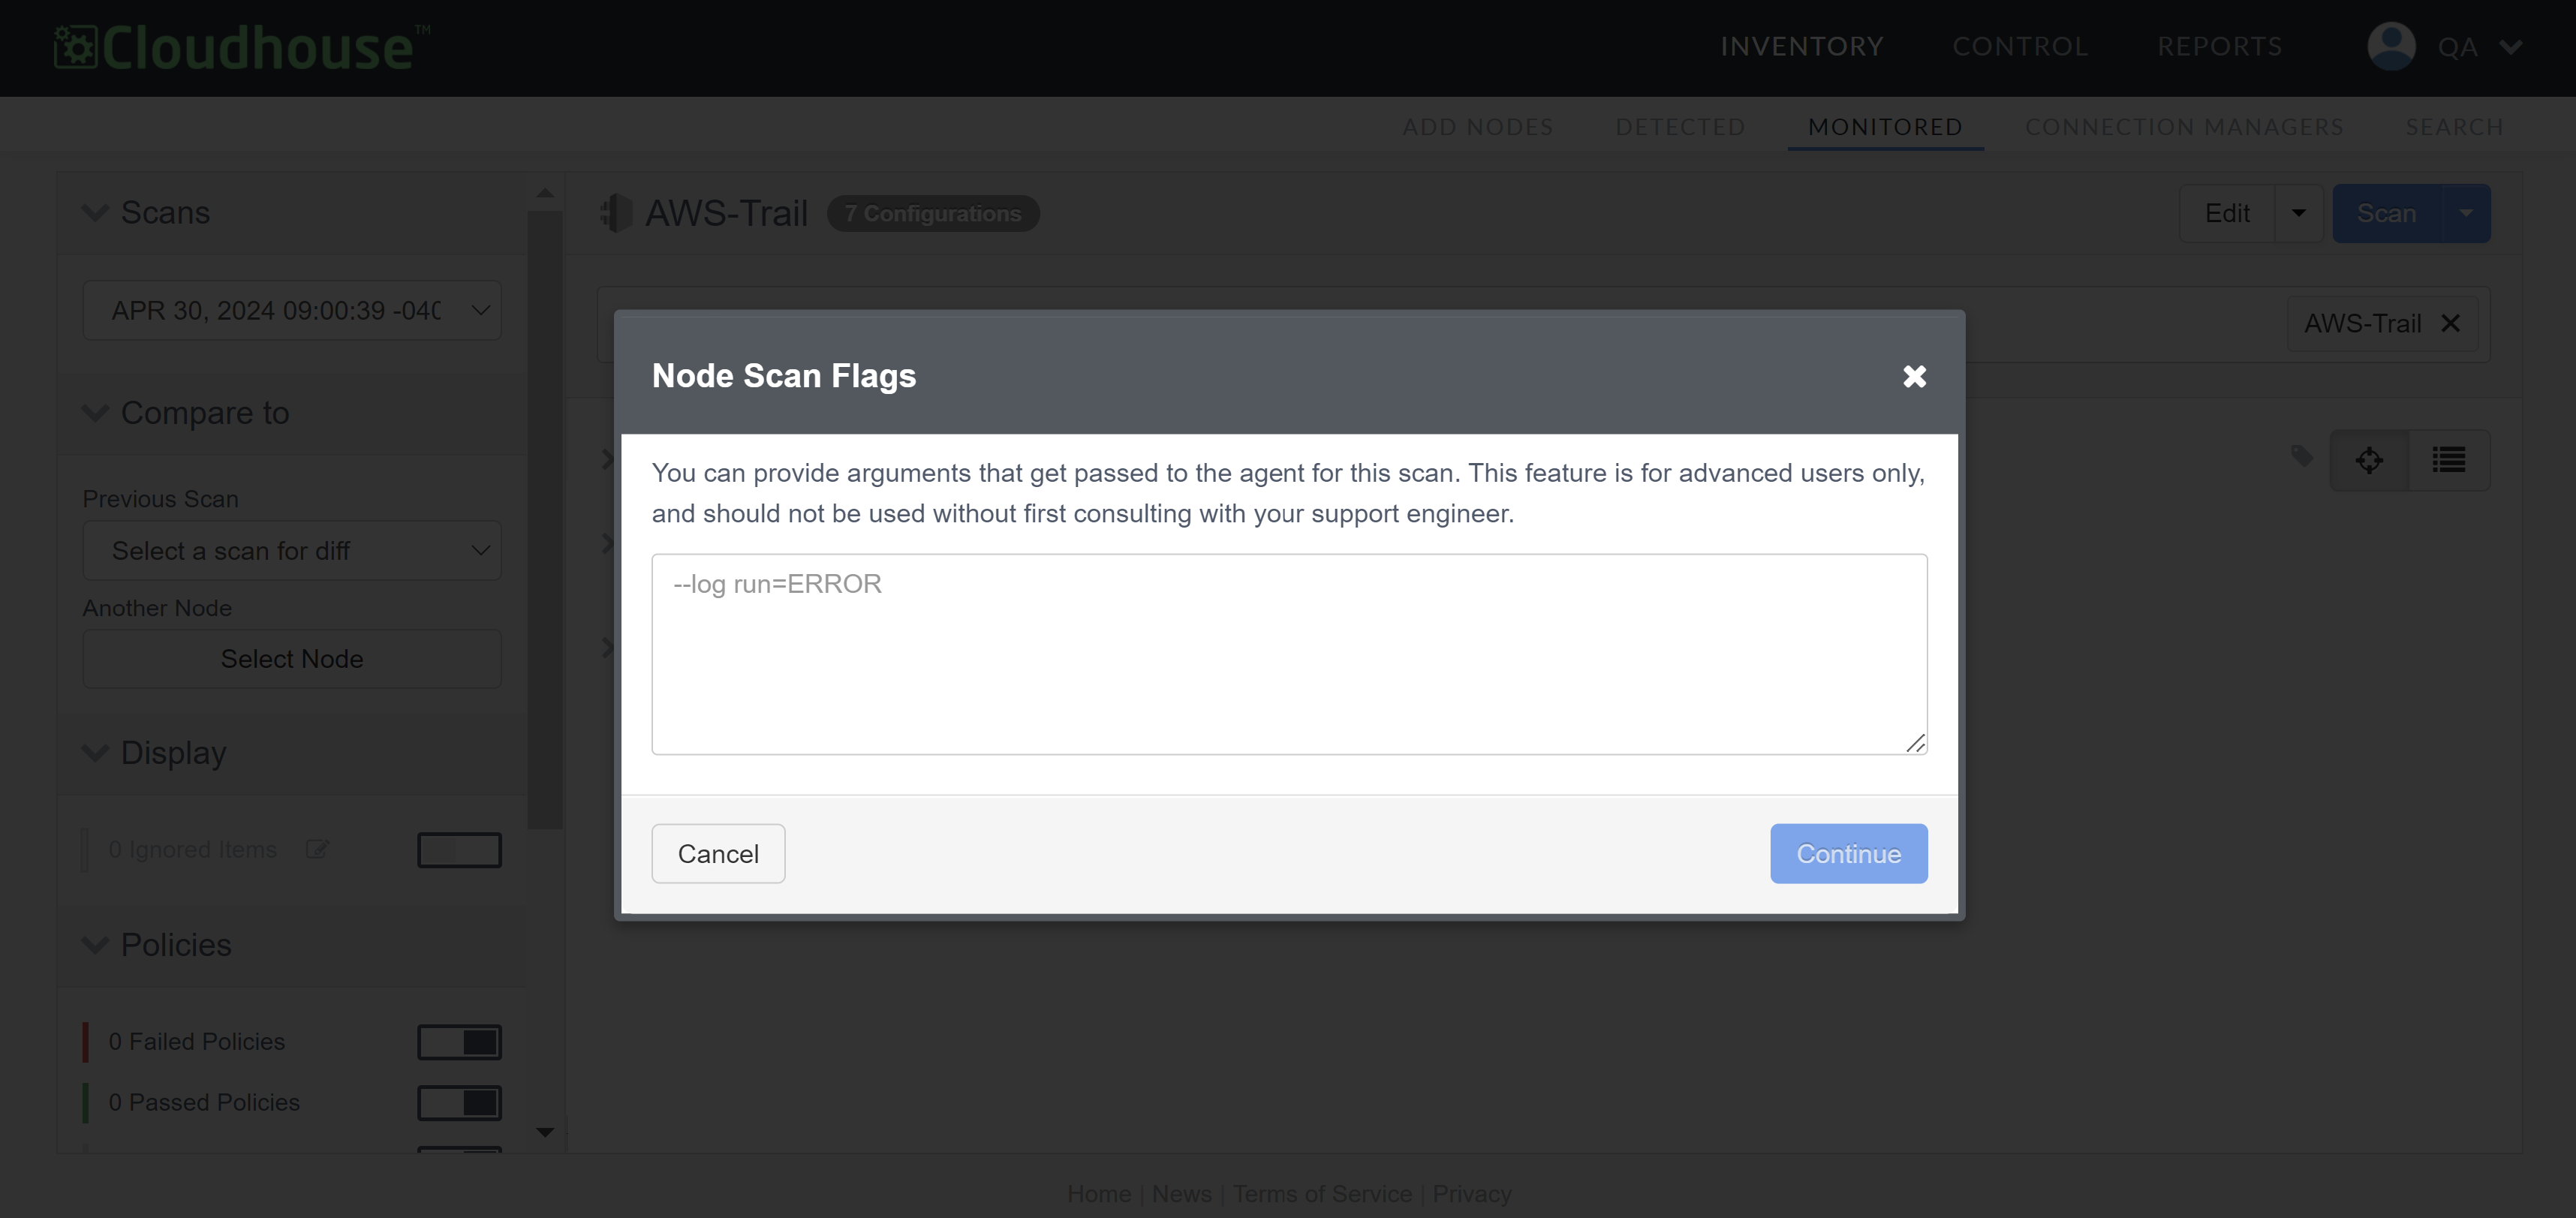
Additionally, you can click the Scan drop-down to display the With arguments option. If selected, the Node Scan Flags dialog is displayed. Here, you can provide arguments that get passed to the Agent during the scan. This option is not available for website nodes, as they are not scanned using an Agent.
Warning: This is for advanced debugging purposes only and should not be used without first consulting with your support engineer.
Automated Scans
Guardian offers different ways you can configure automatic node scans: you can schedule a recurring scan job according to a chosen interval, or you can configure a node scan to start when certain events take place, rather than wait for the next scheduled scan. See below for more information on each of the automated scans available.
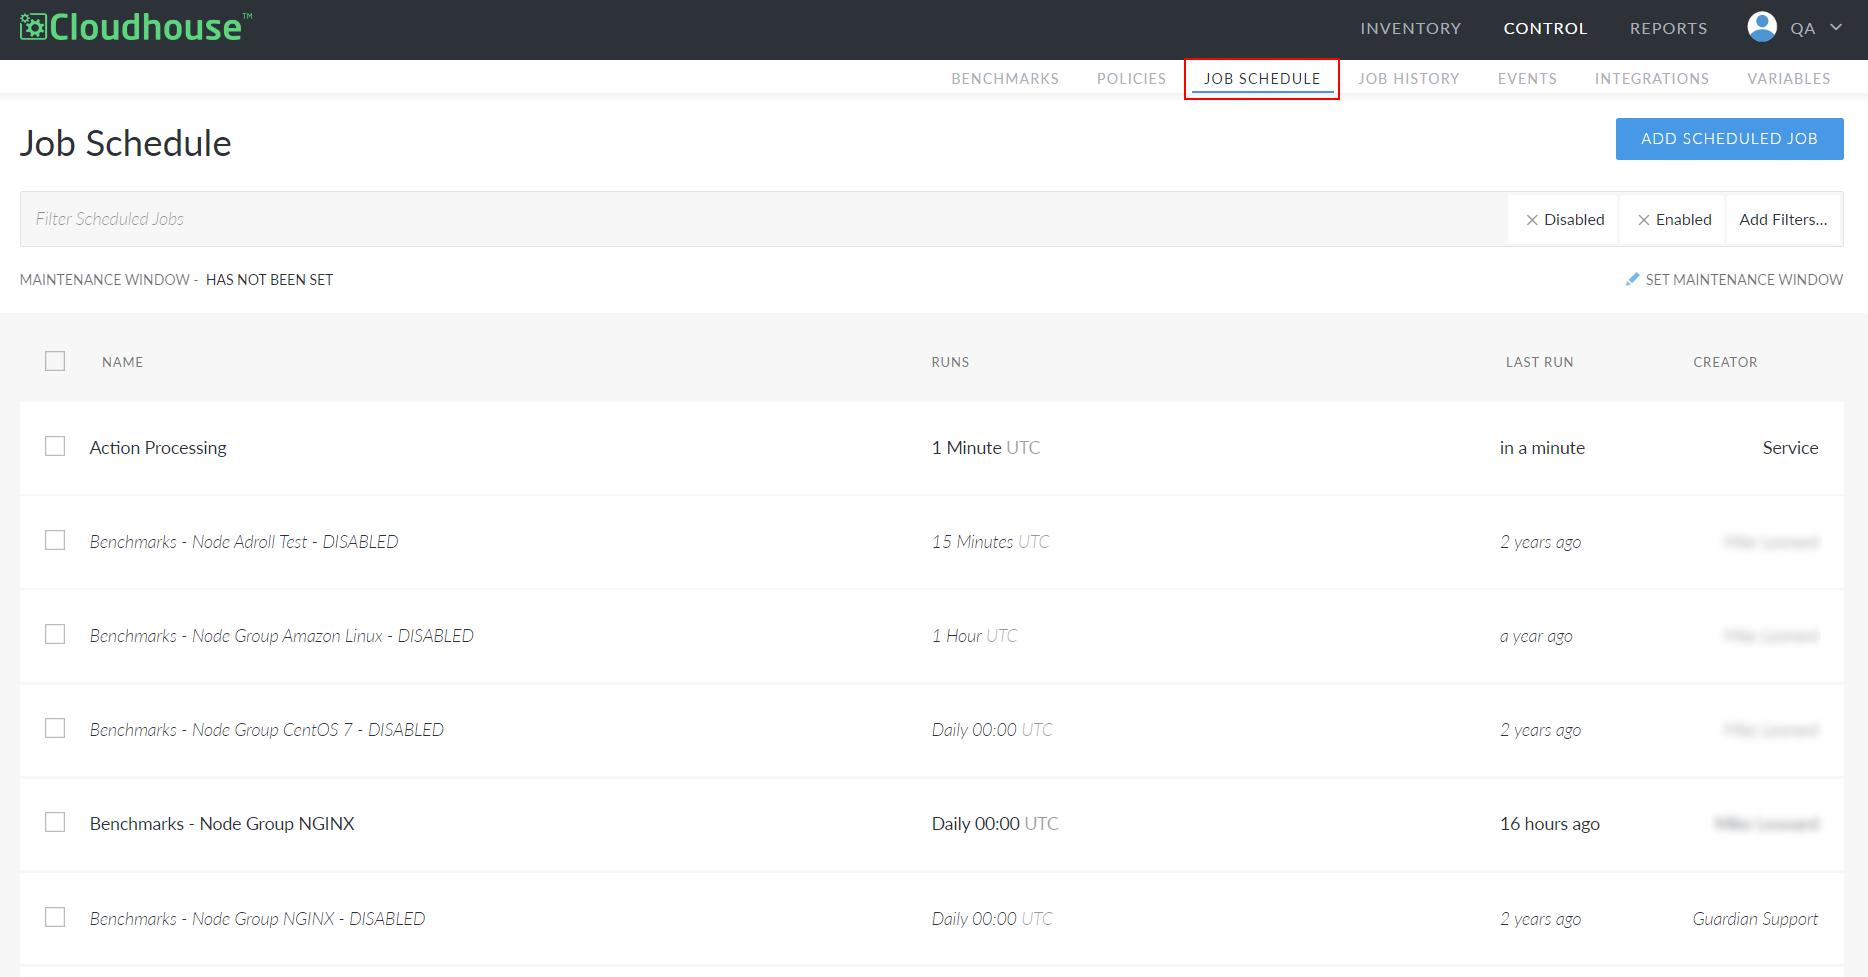
Job Schedule
In the Job Schedule tab (Control > Job Schedule), you can schedule a recurring scan job for a node, node group, or environment to run according to a specified schedule. In contrast to a manual scan, a scheduled job enables you to automate the process of scanning your nodes according to a recurring interval. For example, you could configure a node or node group to be scanned every 15 minutes or every 7 days. By setting up a scheduled scan job, you can better track your nodes' configuration differences over time. We recommend setting up a scheduled scan job for all of the nodes within your Guardian instance. For more information on how to add a scheduled scan job, see Scan – Job Type.
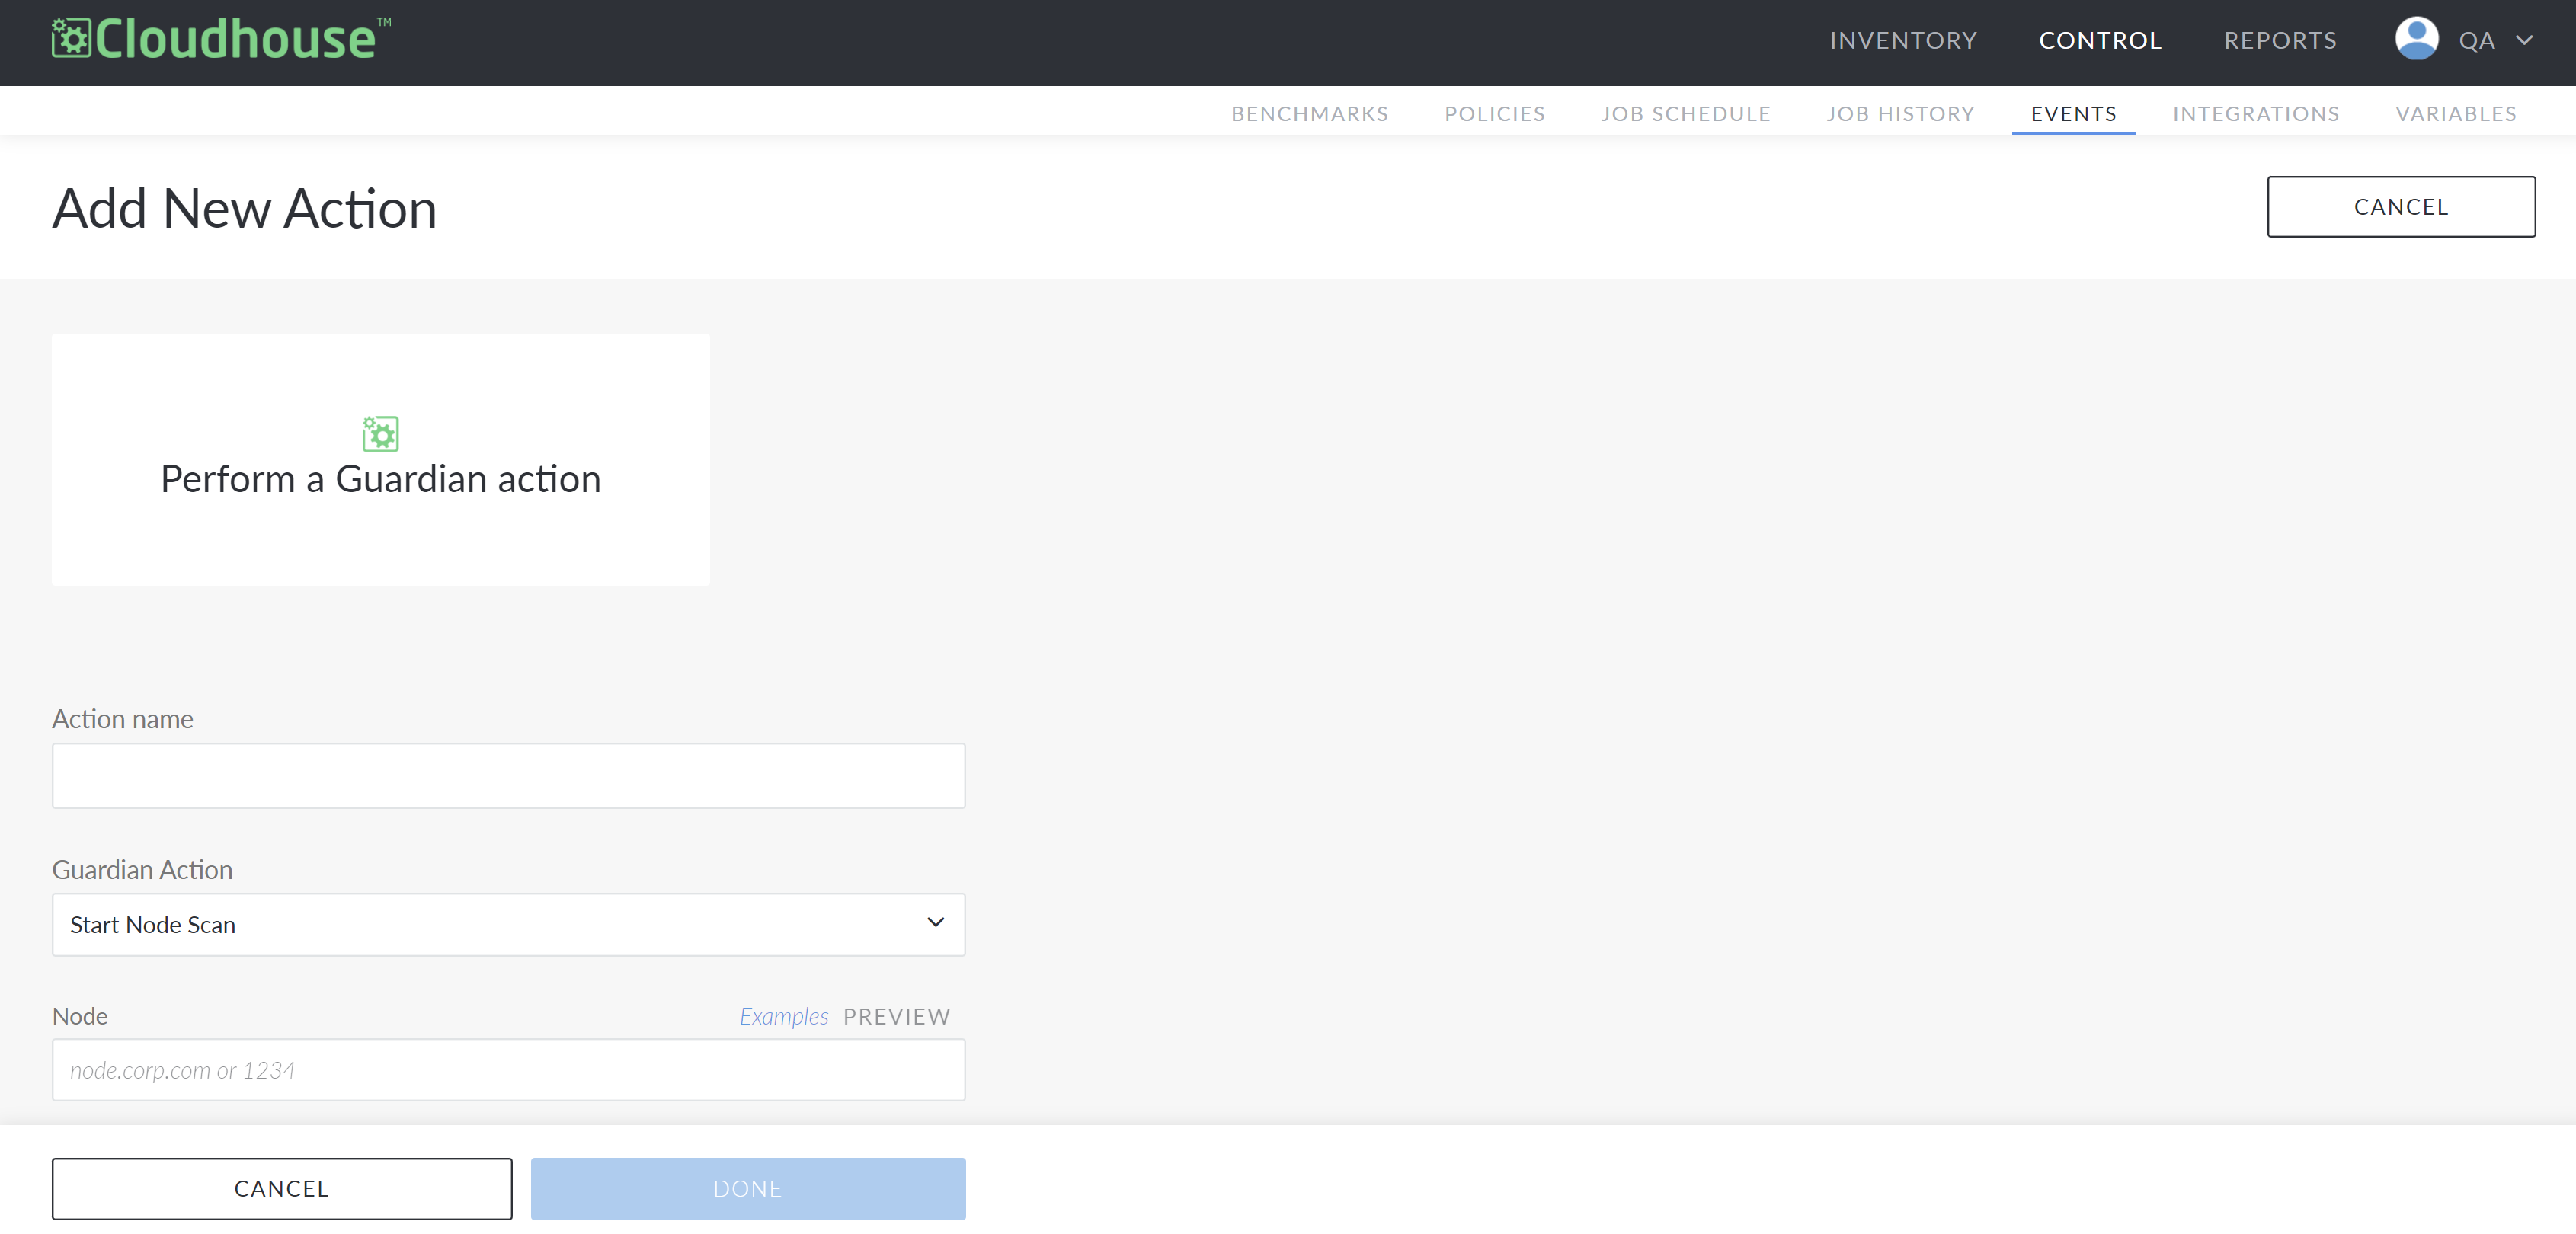
Event Actions
Guardian offers the ability to configure actions that automatically occur when certain events take place. You can use this feature to automatically start a node scan. For example, if a specific change is detected within your Guardian instance that may pose a risk for a specific node (or nodes), this action can run a node scan immediately rather than waiting for the next scheduled scan. For more information, see Action: Perform a Guardian Action.
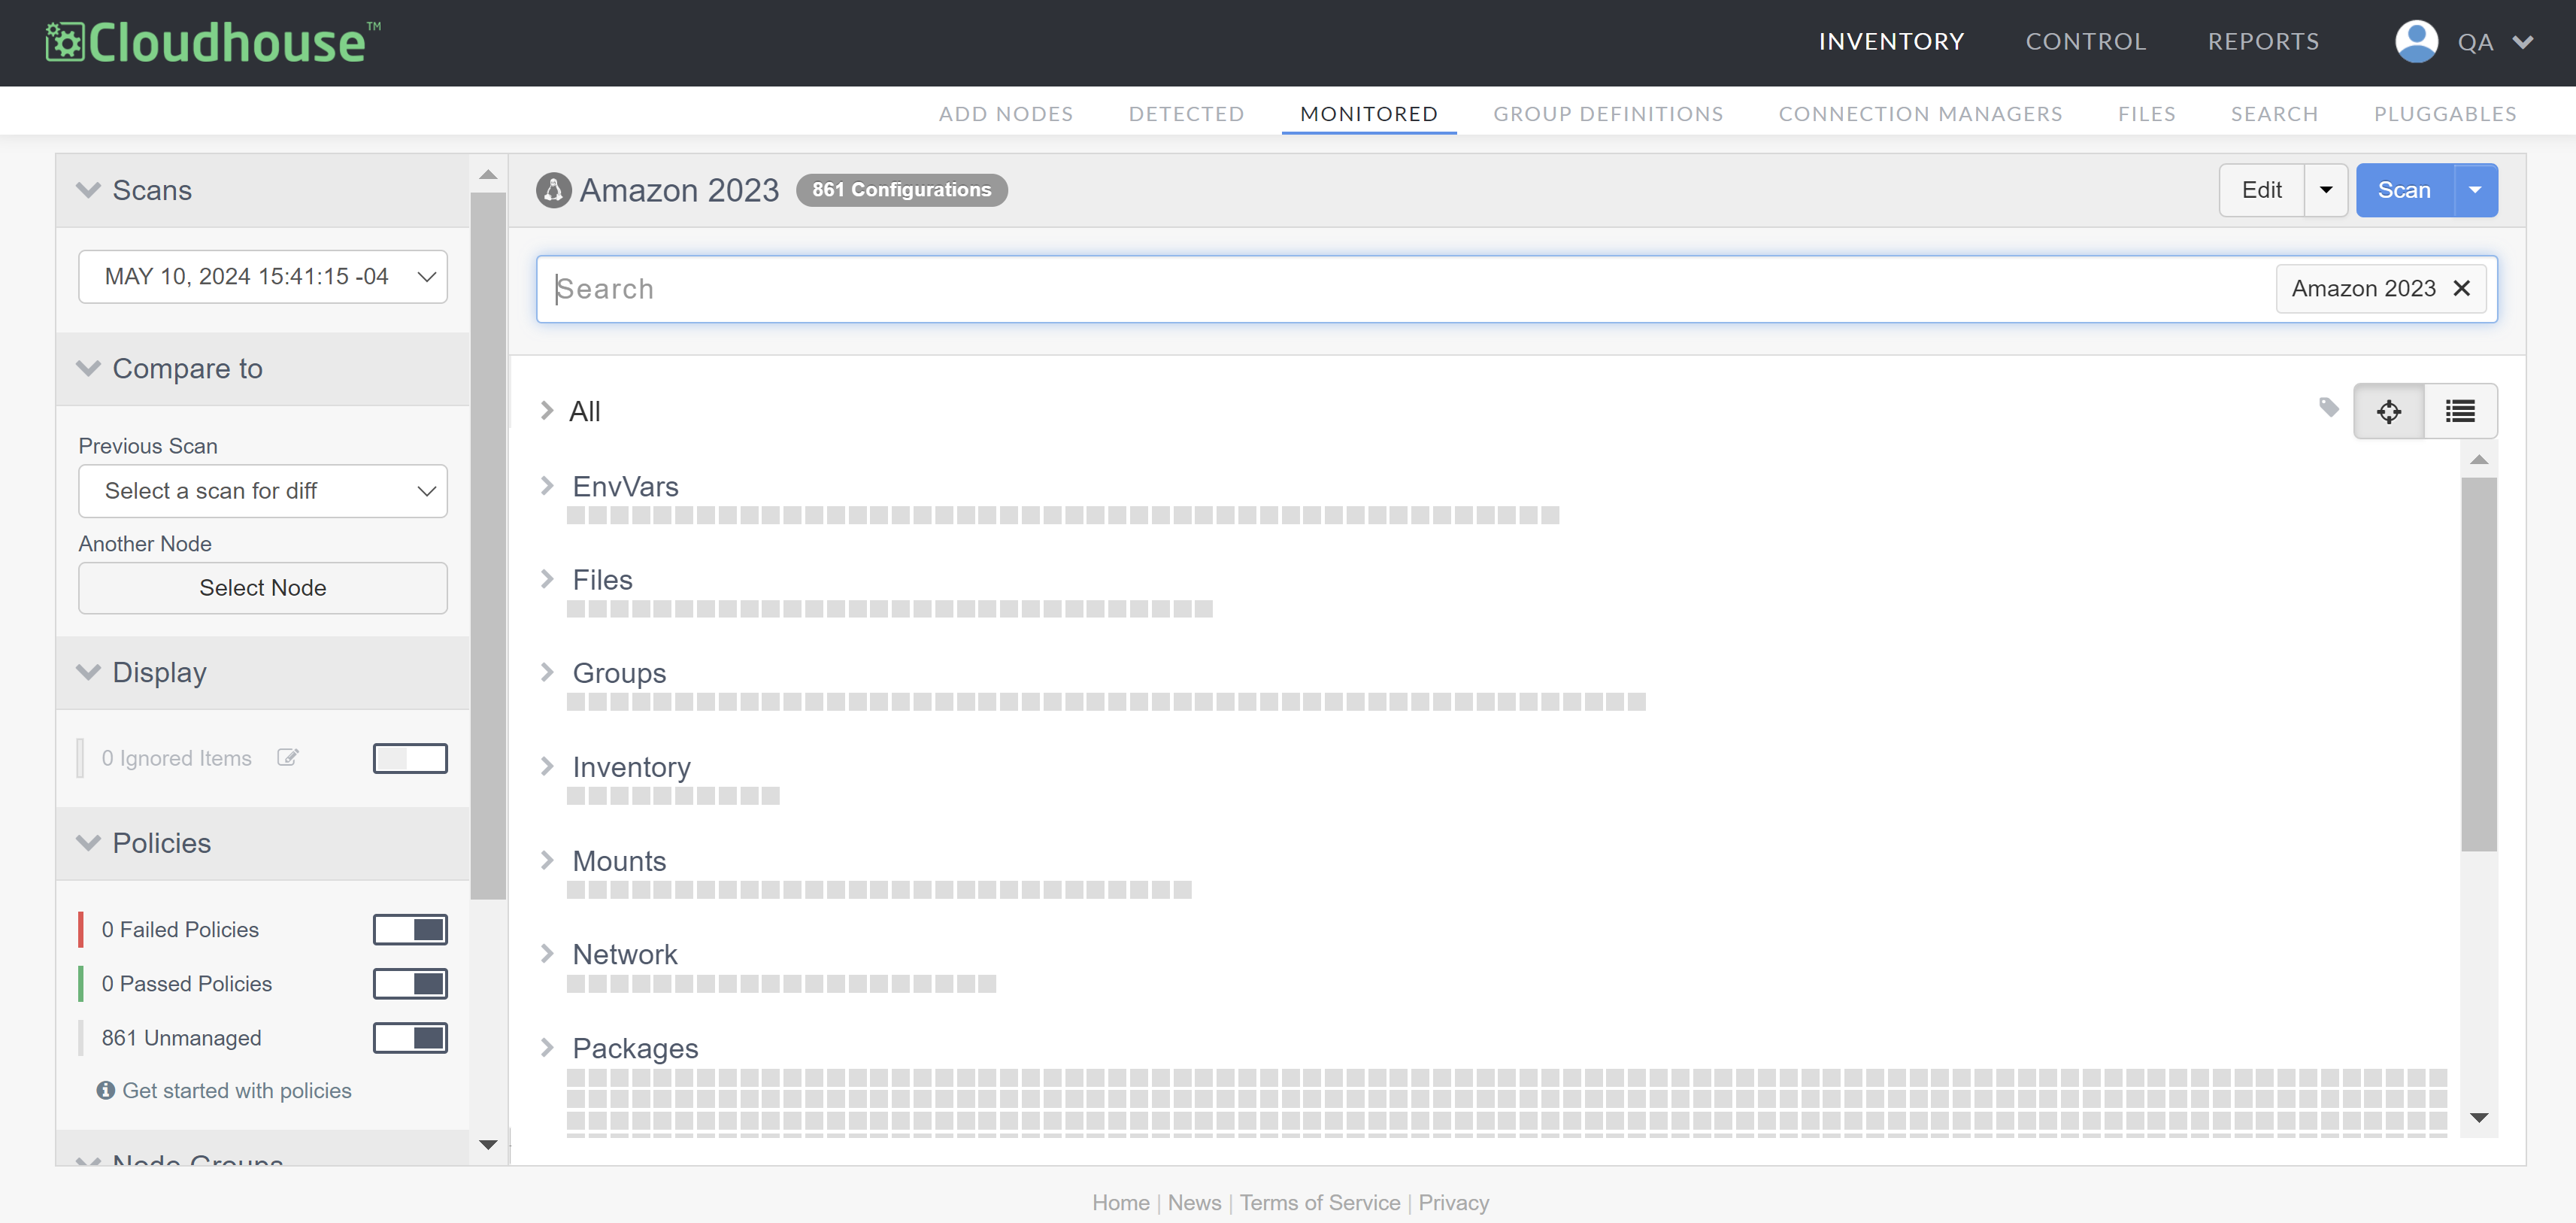
Node Scan Results Analysis
The Monitored tab allows you to edit, scan, troubleshoot, and add additional assets for monitoring within their respective areas. Once a scan is complete, click the node you want to analyze the results from the list of options.

Note: Nodes on the Detected tab (Inventory > Detected) are not scanned. They must be promoted to the Monitored tab, either manually or automatically, for scanning. For more information, see Detected Nodes.
The node is displayed with the results of the most recent scan. Here, you can select a different scan from the Scans drop-down list, compare the selected scan to a previous scan using the Compare to drop-down list, or click Select Node to select a different node to compare the results of the first scan with. This will generate a difference report for the two nodes to access and compare the complete set of configuration data present on each node, as they occurred on the selected scan dates.
Note: For more information on the various methods available for configuration differencing, see Configuration Differencing.
For example, you could select a scan for node A and compare it to a scan of the same or different date for node B to comparethe differences and similarities between the configuration items of the two nodes. This feature can be critical in uncovering and understanding inconsistencies within your node set. For more information on how to utilize the full scope of functionality available on this page, see Node Differencing.
Note: If the scan is not returning the data you expect, you can access the error report to determine the cause of failure in the Job History tab (Control > Job History).
Scan Options
Once a scan is complete, the Scan drop-down in the Monitored tab allows you to see further scan actions you can take to a node or node group selected. For example, you may view a detailed change report of the scan or export a CSV file with the complete set of scan options applied.
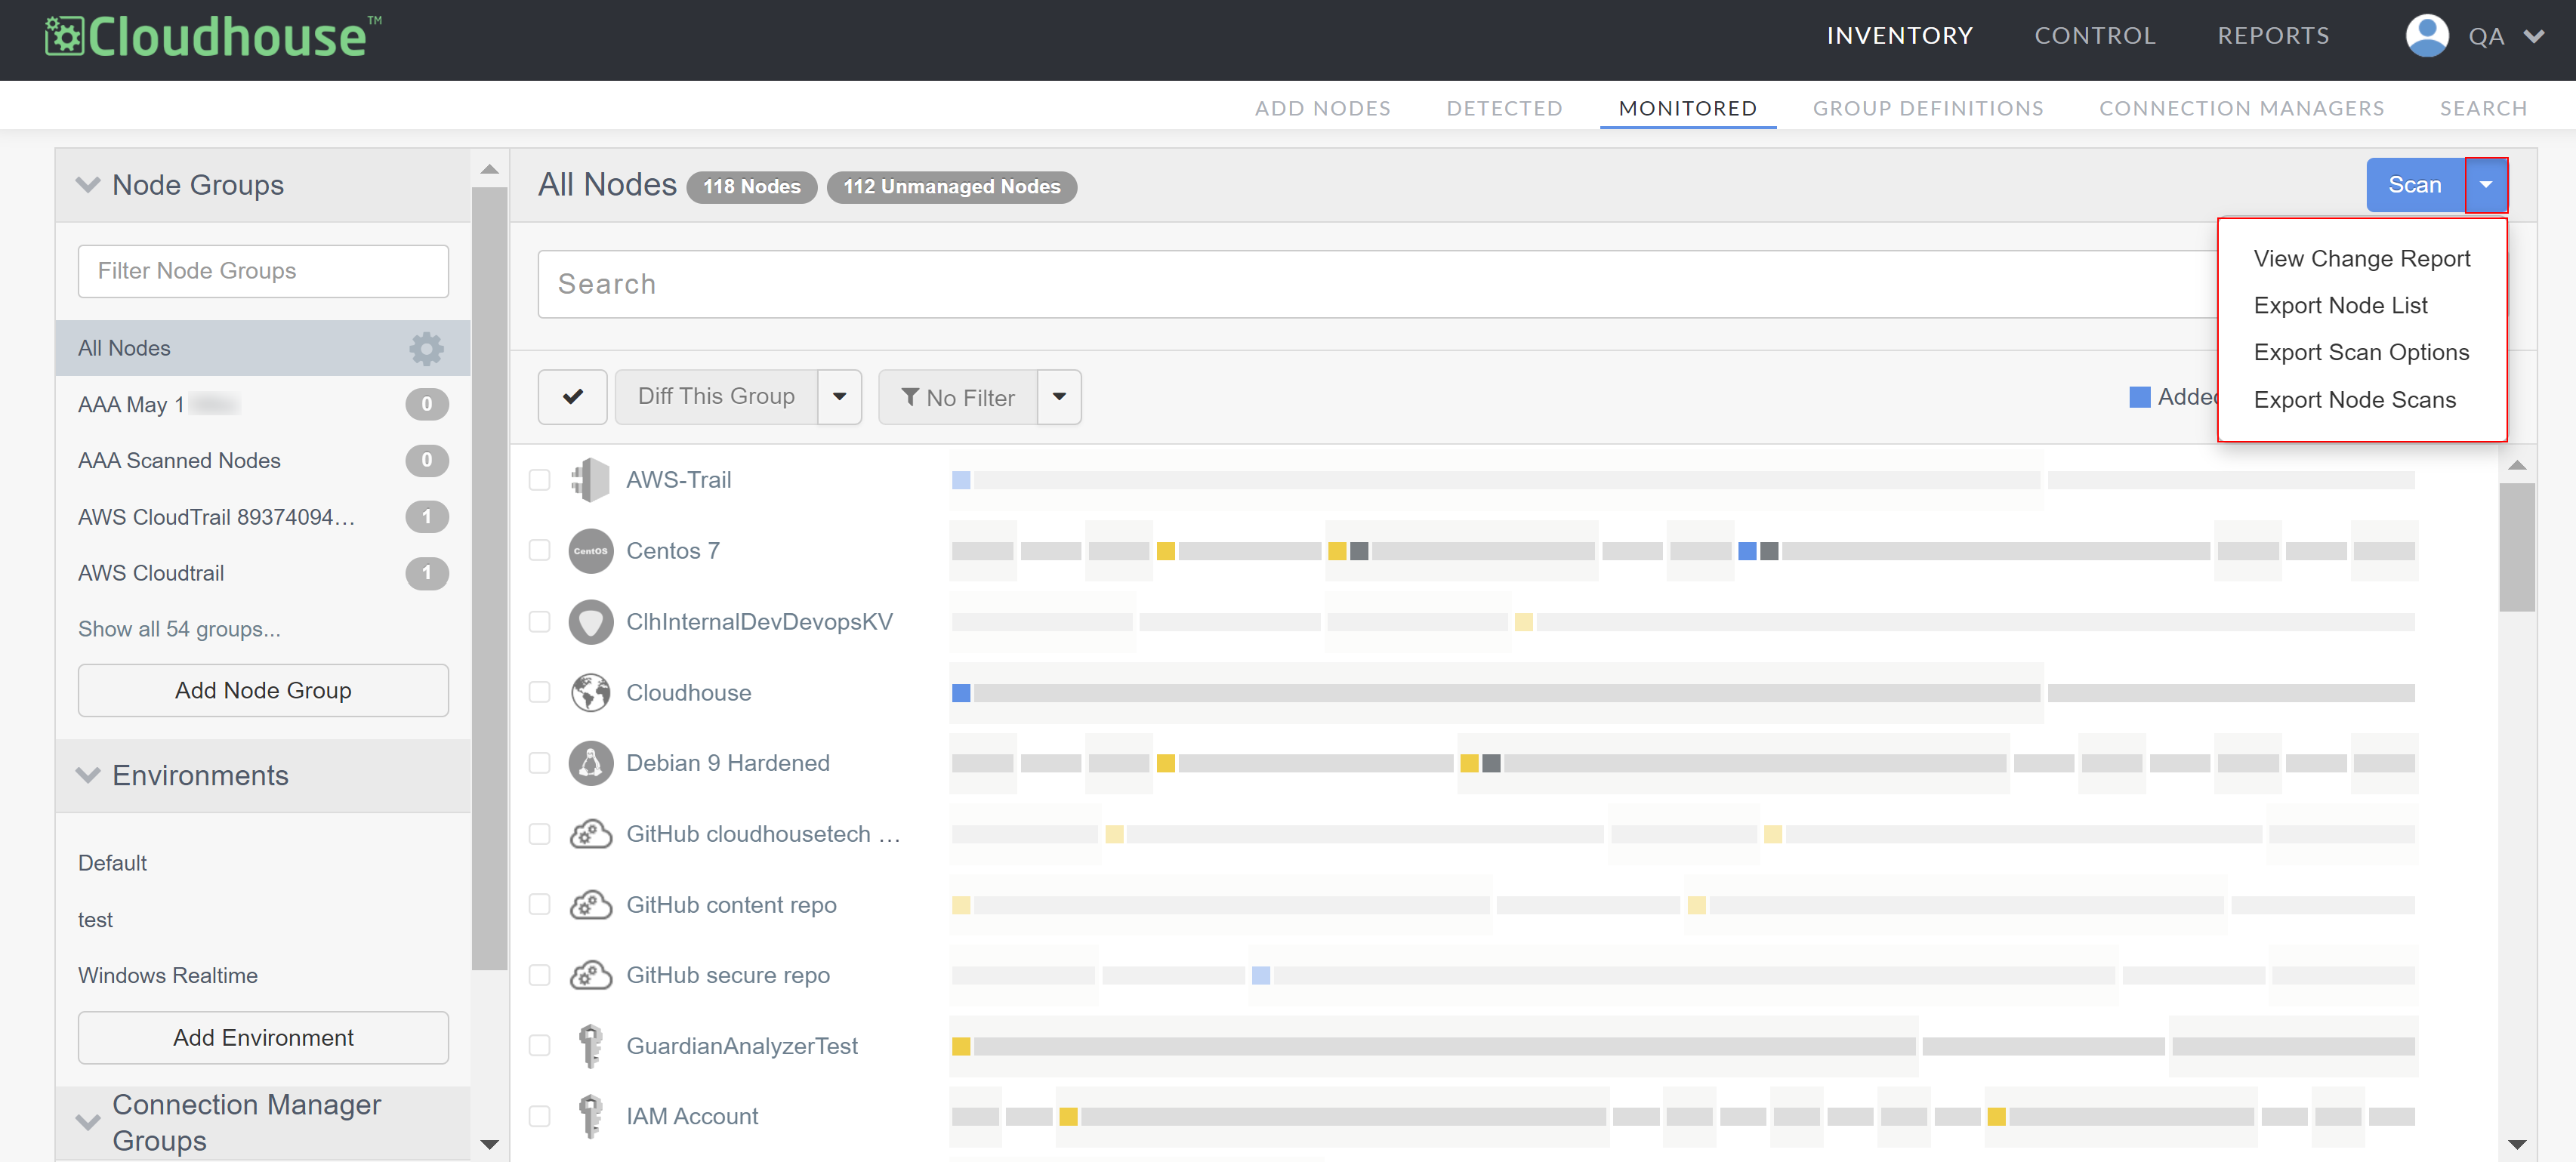
Here, the following options are displayed.
| Option | Description |
|---|---|
| View Change Report | Click to generate a detailed change report for the selected node. If selected the Change Report tab (Reports>Change Report) is displayed. Here, you can set a Time Span and filter options to customize the output. For more information, see Change Report. |
| Export Node List | Click to export a list of the nodes contained within the selected node group within a CSV file. If selected, the file is downloaded locally to your device. |
| Import Scan Options | Click to upload a JSON file containing a list of scan directory options to be added to the node group's settings. |
| Export Scan Options | Click to export the complete set of node scan options within a file. If selected, the file is downloaded locally to your device within your format of choice. |
| Export Node Scans | Click to export the results of the most recent scan within a ZIP file. If selected, the file is downloaded locally to your device. |